
How Much Have Social Security Claiming Ages Increased?

The brief’s key findings are:
- Since the mid-1990s, the average retirement age has risen by three years.
- The question is, to what extent has working longer translated into delayed claiming of Social Security benefits?
- Two metrics are relevant here: 1) the share of all initial claimants who are age 62; and 2) the share of all workers turning age 62 who claim at 62.
- Both show a steep drop in the share of people claiming at 62 over the past two decades, a trend that continued even through COVID.
- As a result, the average claiming age has risen during this period by about two years, somewhat less than the average retirement age.
Introduction
Working longer – when possible – has been generally accepted as good advice for a secure retirement. It directly increases current income; it allows people to contribute more to their 401(k)s; it shortens the period of retirement; and, importantly, delaying claiming of Social Security results in a much higher monthly benefit. The good news is that people have responded; the long-term trend toward earlier retirement came to a halt in the mid-1980s, labor force participation rates at older ages began to increase in the mid-1990s, and since then the average retirement age has increased by three years. The question is the extent to which working longer has translated into delayed claiming of Social Security benefits.
Some information can be gleaned from the claims data published annually by the U.S. Social Security Administration (SSA). These data show, for all workers claiming benefits in a given year, the percentage who are ages 62, 63, 64, etc., which is informative for any given year. But when the size of the group turning 62 is increasing substantially each year, the claims data underestimate the trend toward later claiming. That is, the data will show age-62 claimants making up a larger portion of total new claimants in a given year even if a smaller percentage of those age 62 claim immediately. To accurately follow claiming behavior over time, one must look at cohort data. Such data show, of the potential claimants turning 62 in a given year, the percentage who claim as soon as possible. This brief uses both sources of data to look at the short-term – pre- and post-COVID – and long-term trends in claiming.
The discussion proceeds as follows. The first section uses the annual claims data to document the change in claiming from 2019 to 2023 and the percentage claiming at 62 from 1985-2023. The second section describes the change beginning in the mid-1990s in the number of people turning 62 each year and discusses how this “cohort effect” exaggerates the number claiming at 62 in the published numbers. It also notes that, recently, 62-year-olds have stabilized as a share of the population so shifting sizes of age groups is not distorting current comparisons going forward. But birth-year data are essential for any historical comparisons, so the third section compares from 1985 to 2023 the claim-age and birth-year data for claiming at age 62 and the average claiming age using the two sources of data. The final section concludes that, no matter what the data source, people are delaying claiming, although the two-year increase in the average claiming age from 63 to 65 falls slightly short of the three-year increase in the average retirement age.
Data by Claim Year
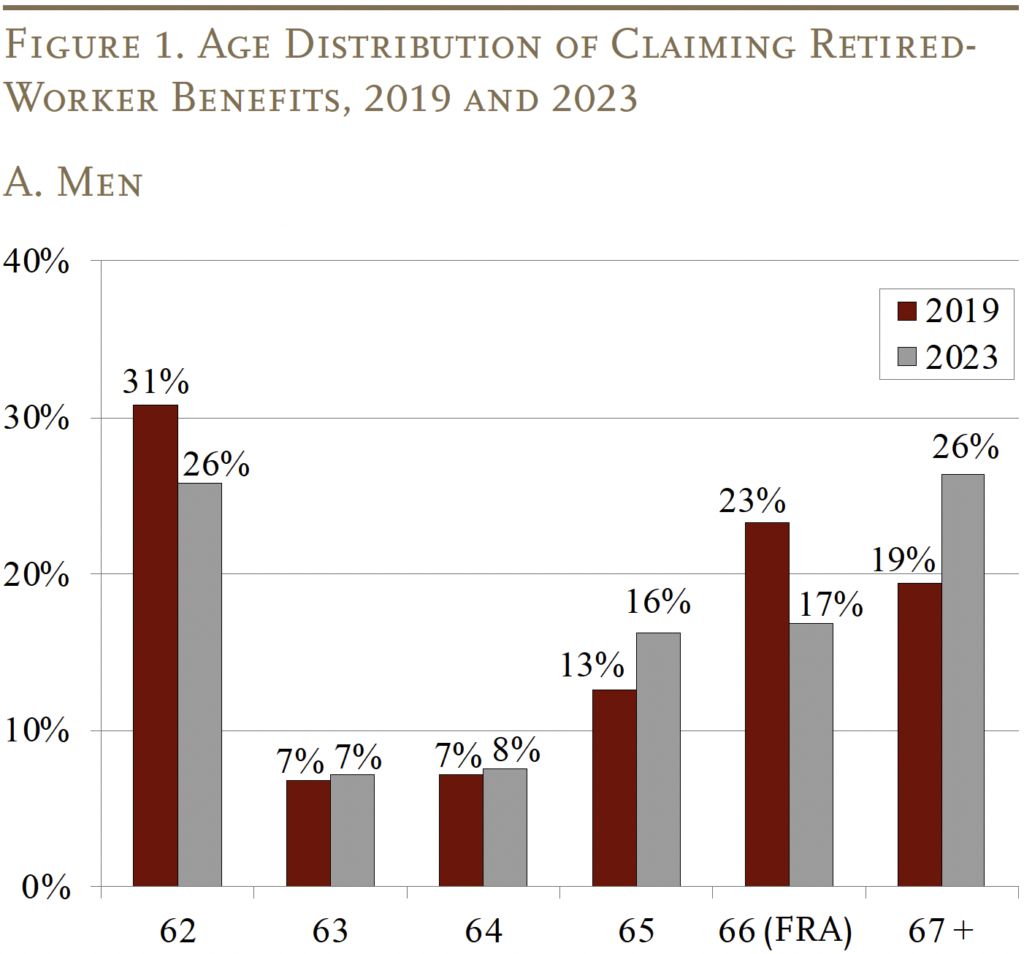
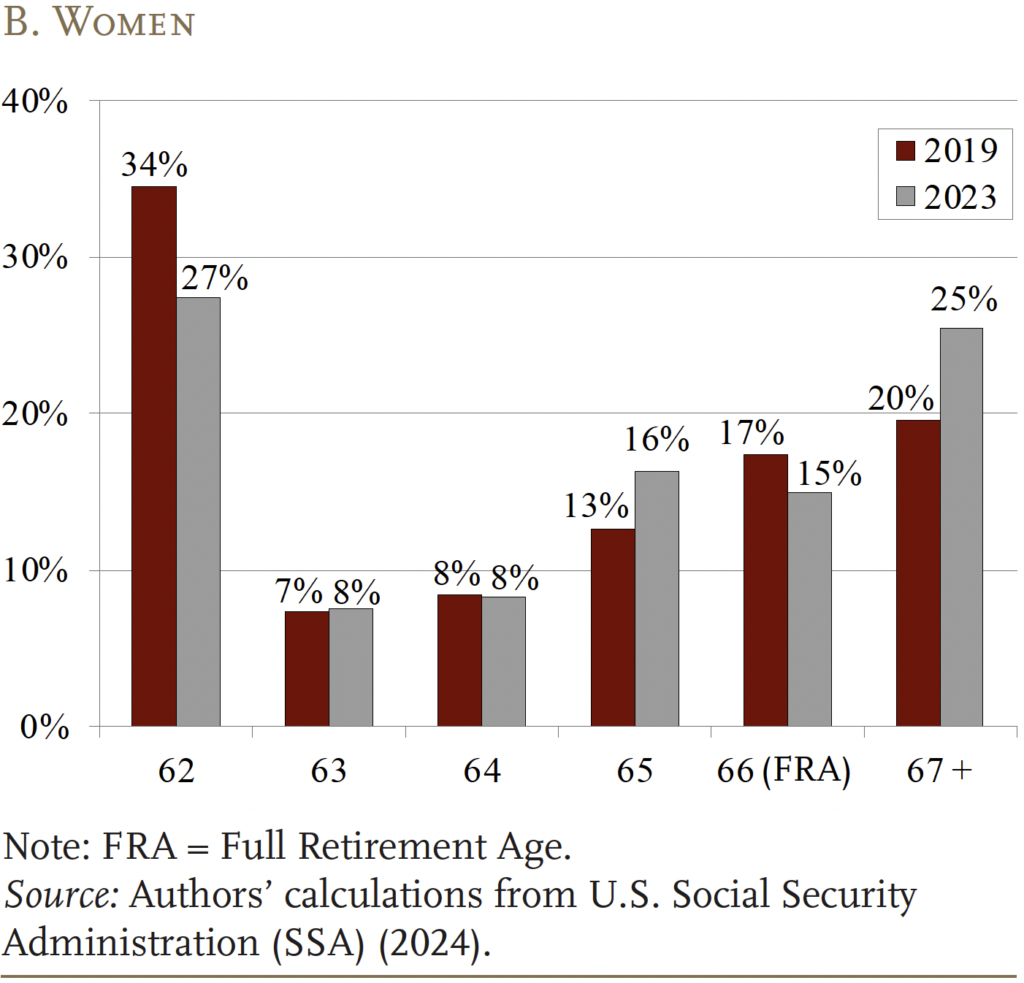
Much has been written about the impact of COVID on the work patterns of older adults. The consensus was that while the pandemic pushed many older adults out of work, it did not result in earlier self-reported retirement or Social Security claiming.1 Indeed, the distribution of both men and women by claiming age supports that early assessment. Of those claiming benefits in 2019 and 2023, a smaller share of both men and women claimed at age 62, and a much larger share claimed at ages 67+ (see Figures 1a and 1b).
These same data can be used to create a historical record of early claiming for the period 1985-2023 (see Figure 2). Over that time, despite the bias created by rapidly increasing numbers of 62-year-olds, the percentage claiming early began to drop in 2005 – declining from around 60 percent to less than 30 percent.
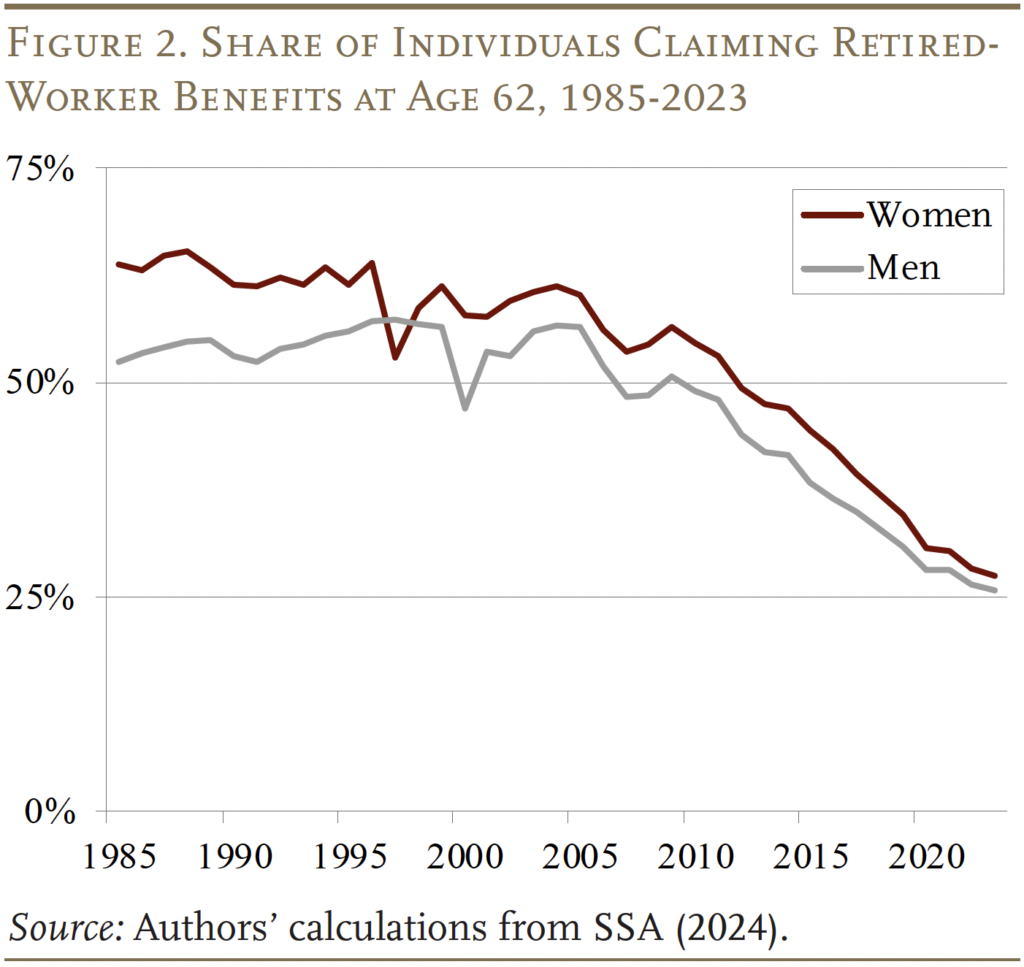
The problem with this figure is that the pattern is inconsistent with the fact that the uptick in work effort actually began in the mid-1990s not in 2005. The inconsistency arises because the number of people turning age 62 started to increase dramatically in 1997, making the claim-year data look like many were opting for early claiming – the so-called “cohort” effect.2
The “Cohort” Effect
An example provides the intuition behind the “cohort” effect. Suppose that beneficiaries can only claim at age 62 or 63 and that 55 percent of all people born in any given year will claim at age 62 and the other 45 percent will claim the following year when they turn 63. If the number of people who attain ages 62 and 63 remains constant from one year to the next, then the SSA published data on claim year and the cohort data will tell the same story. If, instead, the number of people attaining age 62 grows by 10 percent in a given year, then the SSA published data will show that 57 percent of people who claim benefits each year are age 62 and that 43 percent are age 63.3 In this case, the SSA published data will exceed the unchanged claiming rate at 62 for each cohort.
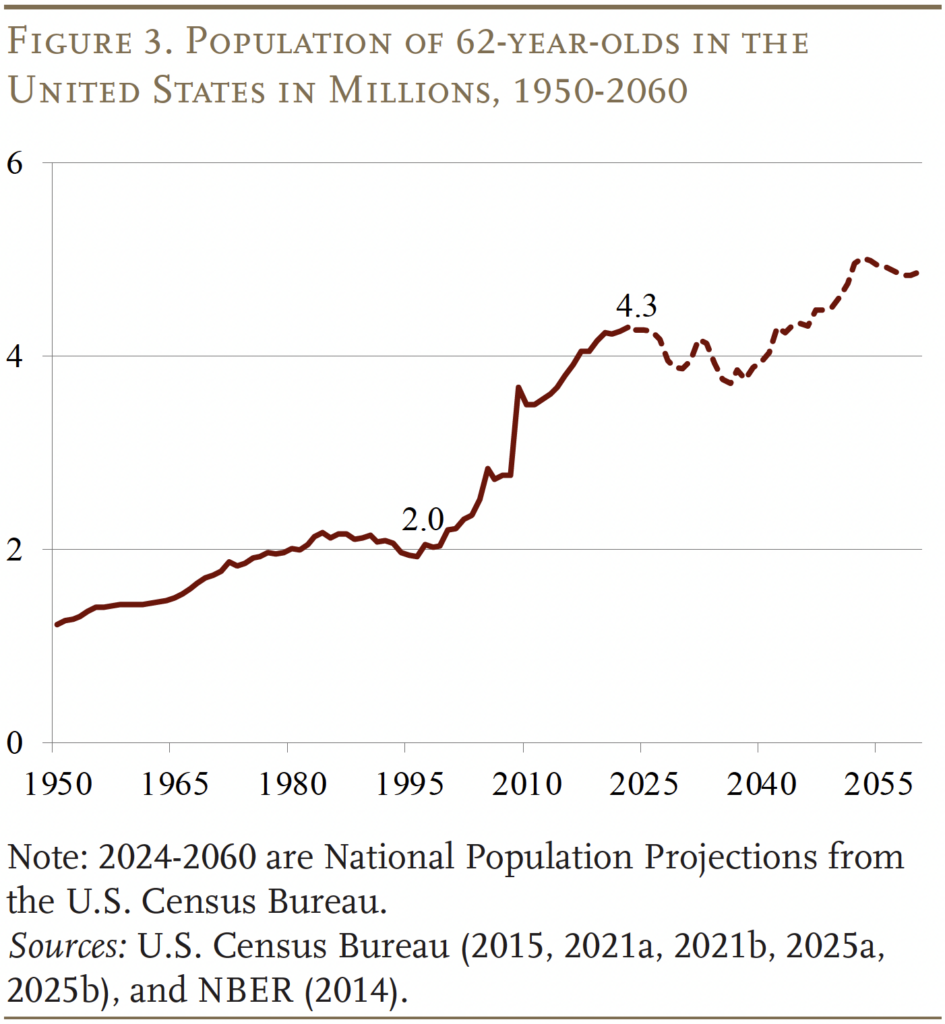
In fact, the number of individuals turning 62 began to increase significantly around 1997. Between 1997 and 2023, the annual flow more than doubled from 2.0 million to 4.3 million (see Figure 3). The increase dramatically altered the age structure of the population eligible for retirement benefits.
The only way to isolate the behavior of, say, 62-year-olds is to determine the percentage of all individuals born in a given year who claimed retired worker benefits at 62. The calculation is possible because SSA has unpublished data on the number of people eligible for retired-worker benefits by birth year. The task is then to allocate cohort totals among claiming ages based on SSA’s published data.4
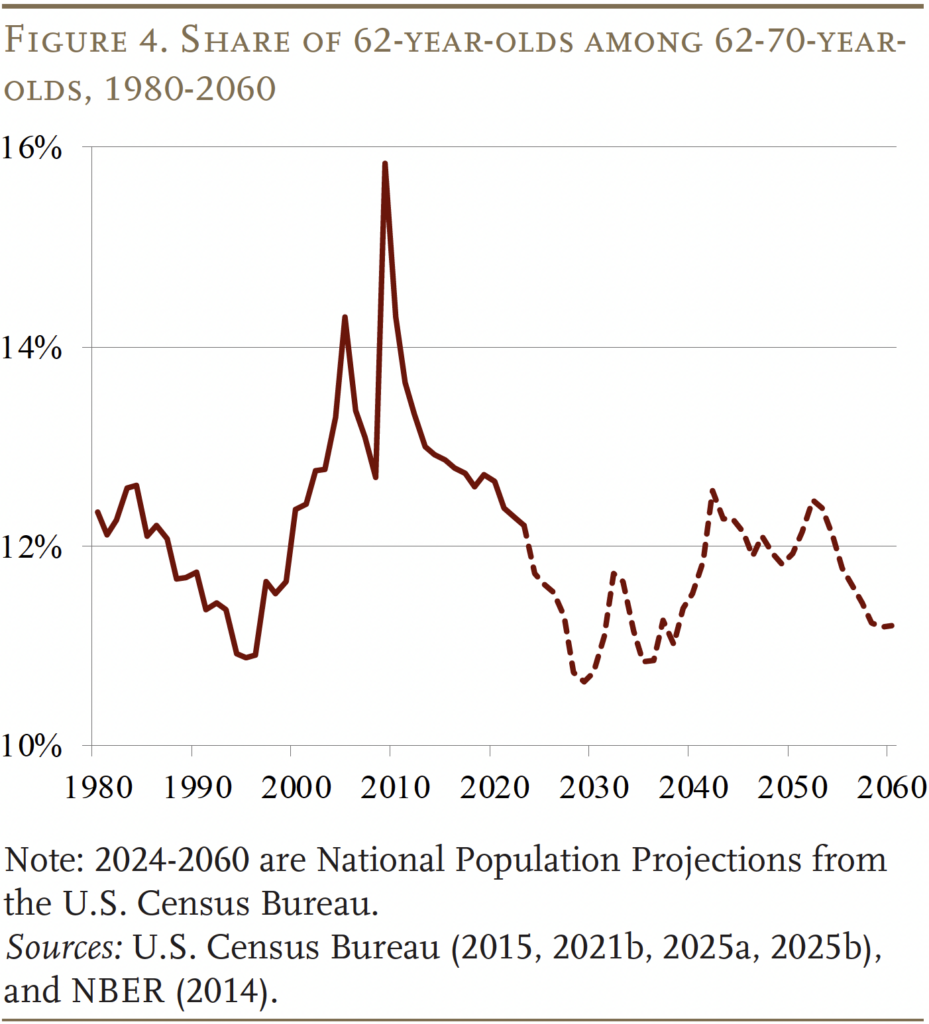
Before reporting the results by birth year, it should be noted that the “cohort effect” is only relevant for evaluating long-term trends. The share of 62-year-olds among those 62-70 has now returned to roughly 12 percent of the total (see Figure 4), which means that, currently, the published data by claim age will provide a meaningful depiction of claiming trends. That is, the published data for claiming between 2019 and 2023 do not include any cohort effects. For a historical perspective, however, the birth-year data remain essential.
Comparing Results by Claim Year and Birth Year
Figure 5 compares the percentage of men claiming at age 62 on a claim-year and birth-year (cohort) basis. The two approaches provide very similar results until 1997; afterward, the two series start to diverge. The cohort data reflect the uptick in labor force activity beginning in the mid-1990s – with longer work lives leading to later claiming – and show a much larger decline over the last three decades than the claim-age data.
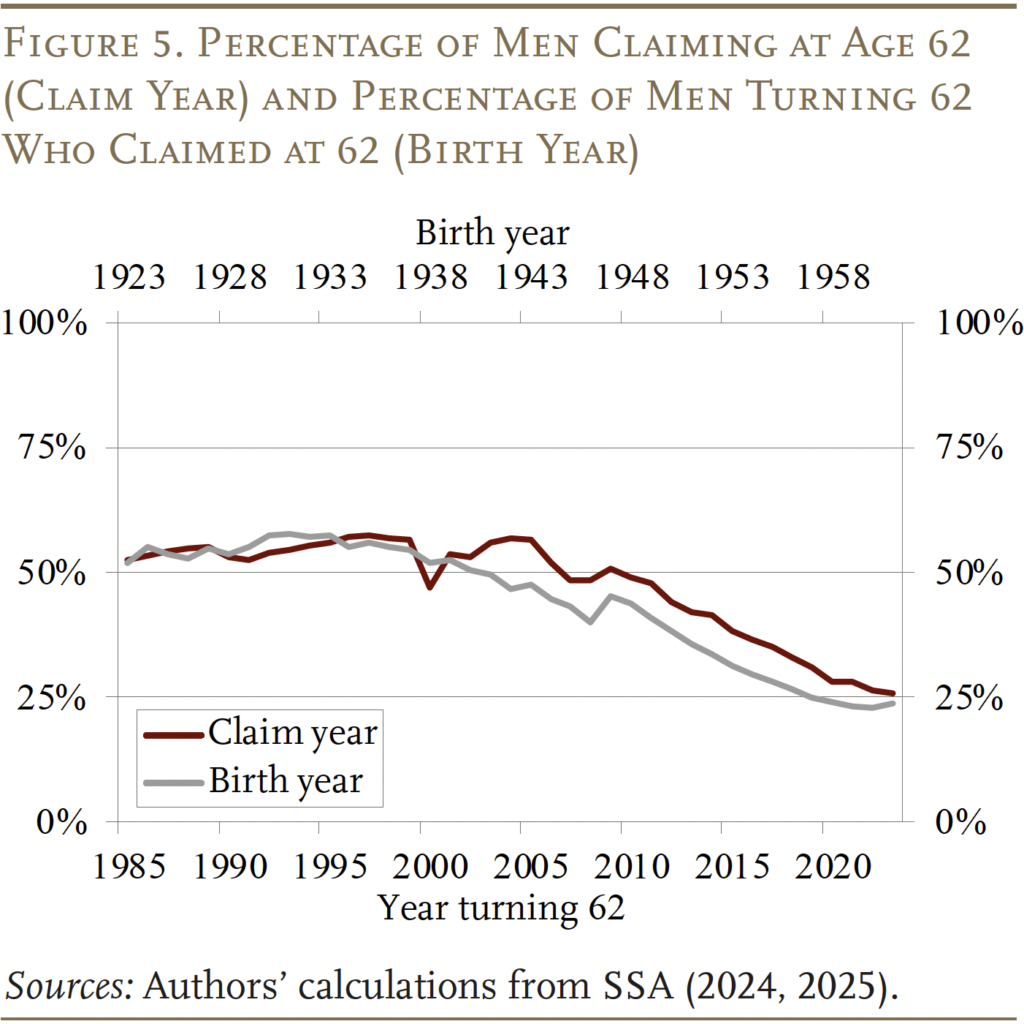
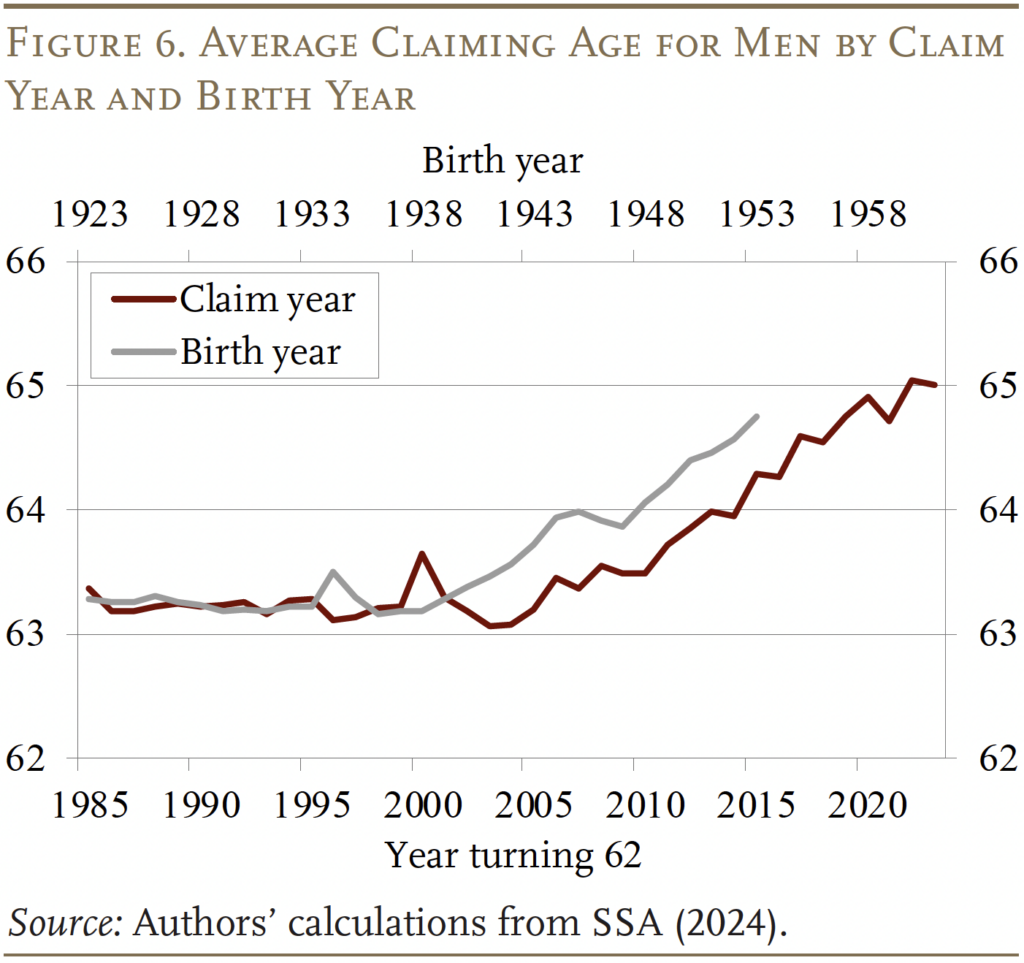
Figure 6 shows the trend from 1985-2023 in the average claiming age for men on a claim-year and birth-year basis (those cohorts turning 62 after 2015 do not reach age 70 by 2023). As one would expect, the increase is larger using the birth-year data, but both support the contention that the delay in retirement has been accompanied by a delay in claiming. The delay in claiming, however – even using the birth-year data – is only about two years – slightly less than the three-year increase in the average retirement age.5
Conclusion
The good news is that, prior to COVID, the trend over the last 20 years showed a dramatic decline in the percentage of 62-year-olds claiming benefits as soon as they became eligible, and that trend continued through COVID. As a result, the average claiming age has increased, although both the birth-year data and claim-age data show an increase that falls short of the three-year increase in the average retirement age.
References
Munnell, Alicia H. 2025. “Will the Average Retirement Age Keep Rising?” Issue in Brief 25-8. Chestnut Hill, MA: Center for Retirement Research at Boston College.
National Bureau of Economic Research. 2014. “U.S. Census Intercensal Population Estimates.” Cambridge, MA.
Quinby, Laura D., Matthew S. Rutledge, and Gal Wettstein. 2021. “How Has COVID-19 Affected the Labor Force Participation of Older Workers?” Working Paper 2021-13. Chestnut Hill, MA: Center for Retirement Research at Boston College.
U.S. Census Bureau. 2025a. “National Population Characteristics: 2010-2019.” Washington, DC.
__________. 2025b. “National Population Characteristics: 2020-2024.” Washington, DC.
__________. 2021a. “National Intercensal Tables: 1900-1990.” Washington, DC.
__________. 2021b. “National Intercensal Tables: 2000-2010.” Washington, DC.
__________. 2015. “National Population Projections: United States by Age, Sex, Ethnicity and Race for Years 2014-2060” on CDC WONDER Online Database. Washington, DC.
U.S. Social Security Administration. 2025. Unpublished Data on Initial Social Security Benefit Awards and Eligibility Status. Baltimore, MD.
__________. 2024. Annual Statistical Supplement, 2024. SSA Publication No. 13-11700. Baltimore, MD.
Endnotes
- See Quinby, Rutledge, and Wettstein (2021) and citations therein. ↩︎
- Fertility rates hit a low point in the mid-1930s and then began recovering. This pattern (which preceded the beginning of the baby boom era that started a decade later) led to the surge in people turning 62 in the late 1990s. ↩︎
- The calculation is .57 = (1.1*.55)/(1.1*.55+1.0*.45). ↩︎
- For example, the unpublished data show that 863,753 men born in 1923 turned age 62 and became eligible for benefits in 1985. The published data show 448,630 men claimed benefits at 62 in 1985, all of whom by definition must be 1923-cohort men. Similarly, the published data show that 82,900 men claimed benefits at 63 in 1986, 110,580 claimed at 64 in 1987, etc., so the published data allow one to follow the claiming activity of the 1923 birth cohort over time. When the process is complete, it is possible to calculate the percentage of each cohort claiming at each age. ↩︎
- The average retirement age is measured as the age at which 50 percent of the male population is out of the labor force (see Munnell 2025). The pattern showing that the change in delayed claiming is slightly lower than the change in the average retirement age is not surprising because some people claim benefits before they stop working. ↩︎


Chen, Anqi, Alicia H. Munnell, and Nilufer Gok. 2025. "How Much Have Social Security Claiming Ages Increased?" Issue in Brief 25-10. Chestnut Hill, MA: Center for Retirement Research at Boston College.