
New Tool Could Help Public Plans Stay on Course

Alicia H. Munnell is a columnist for MarketWatch and senior advisor of the Center for Retirement Research at Boston College.
Year-to-year changes in unfunded liability show why sponsors are falling short.
The actuarial community seems awash with studies and reports about how actuaries could provide more guidance with respect to the funding of public pension plans. This activity is driven by the drop in funded levels in the wake of two financial crises, the budgetary pressures faced by plan sponsors, and the increased scrutiny of underfunded plans. In addition, the Governmental Accounting Standards Board (GASB) has gone out of its way to say that its financial reporting standards do not constitute funding policy guidance. Everyone seems to agree that plan sponsors need help. Most of the reports suggest that a public sector plan should target to fund 100 percent of its actuarial liabilities over a reasonable period of time.
While we can’t solve all problems, my colleagues and I would like to toss a proposal into the mix. It is not so much prescriptive, but rather will make clear to the plan sponsor the extent to which the plan is making any funding progress. This tool would highlight, on a historical basis, the specific reasons why the unfunded liability has been growing. Every plan’s actuarial valuation reports the Unfunded Actuarial Accrued Liability (UAAL), the change in the UAAL from the prior year, and some information on the factors that led to the change. The task is to simply combine these annual changes over an extended time period.
We did this exercise recently for a sample of plans. As an example, the results for New Jersey’s Teachers Retirement System (TRS) are shown in the Table. The analysis defines five factors that would cause the unfunded liability to grow: 1) investment returns – on an actuarially smoothed basis – that turn out to be less than expected; 2) contributions that fall short of the plan’s normal cost (the value of benefits earned in a given year) and the interest on the unfunded liability; 3) actuarial experience that is worse than expected; for example, retirees living longer than expected; 4) benefit increases; and 5) changes in actuarial assumptions, such as lowering the discount rate.
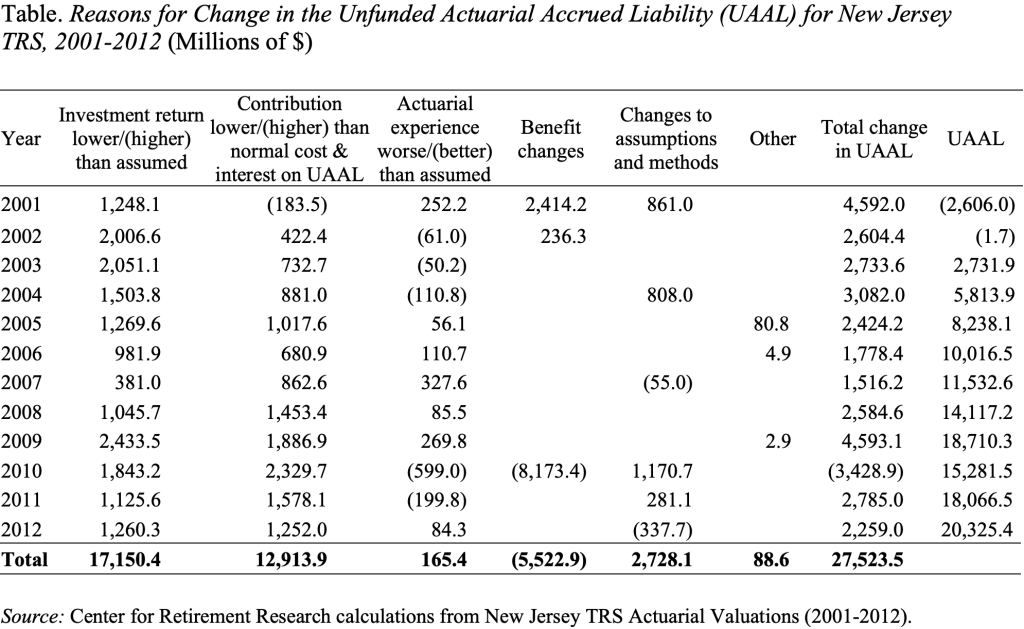
The Table contains a lot of numbers, so it may help to explain what is going on. Starting in 2001, New Jersey TRS was more than fully funded; it had a surplus of $2,606.0 million. In 2002, poor investment returns – measured on an actuarially smoothed basis – and inadequate contributions virtually eliminated the surplus. This pattern of investment losses and underfunding continued until 2013. It was mitigated somewhat in 2010 when the state eliminated the cost-of-living adjustment for all current and future retirees effective October 2011. But, thereafter, continued underpayment of contributions led the UAAL to grow to $20,325.4 million.
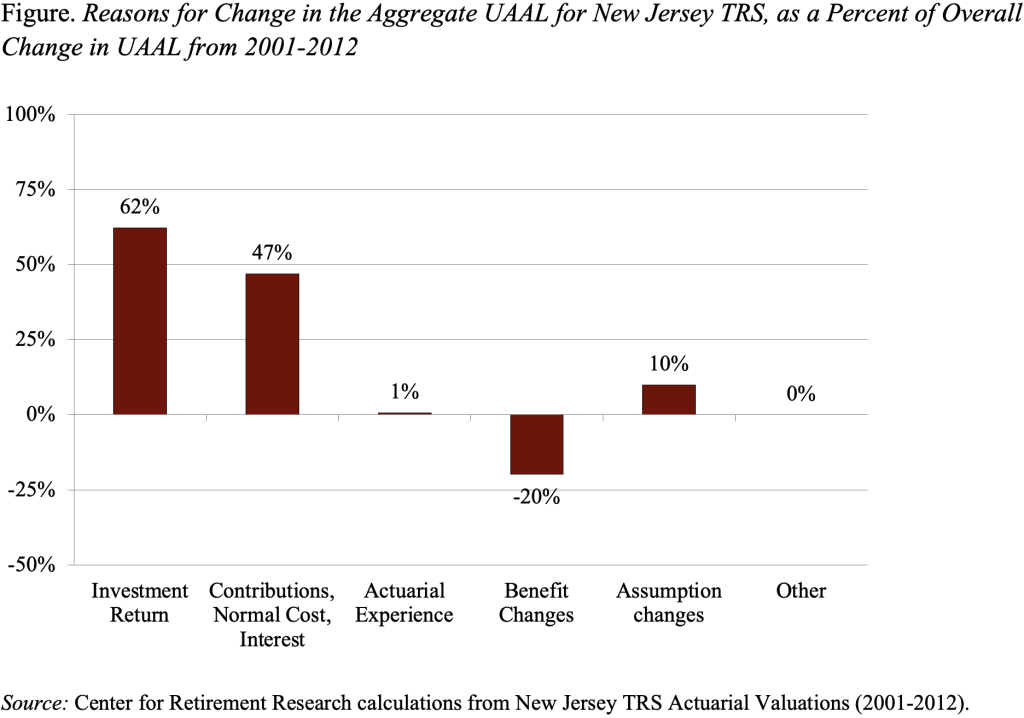
The Figure below summarizes the contribution of the various factors in the Table to today’s unfunded liability for New Jersey TRS. In every year since the turn of the century, the state has failed to contribute enough to cover the normal cost and the interest on the unfunded liability – much less make a stab at paying off the unfunded liability. This shortfall in payments comes close to the two financial crises in its effect on the unfunded liability. In addition, corrections to overly optimistic demographic assumptions (termination, retirement, disability, and mortality) further increased the unfunded liability.
The numbers tell a very clear story that is often obscured in the political debate. For example, for most plans, such an analysis since 2000 would show the impact of two financial crises and highlight the inadequacy of plan contributions. The analysis involves simply combining the annual changes in a plan’s UAAL over time, but the output is powerful. It should be included in every actuarial valuation.