State and Local Pensions Look Healthier – Even with Market Turbulence

Alicia H. Munnell is a columnist for MarketWatch and senior advisor of the Center for Retirement Research at Boston College.
Yes, fixed income was hit by rising interest rates, but it’s a small share of plan portfolios.
My colleagues JP Aubry and Yimeng Yin just released an update on state and local pension plans. Their analysis compared 2023 to 2019 – the year before all the craziness began. Think of the unusual events that have occurred in the last few years: 1) the onset of COVID; 2) the subsequent COVID stimulus; 3) declining interest rates; 4) rising inflation; and then 5) rising interest rates.
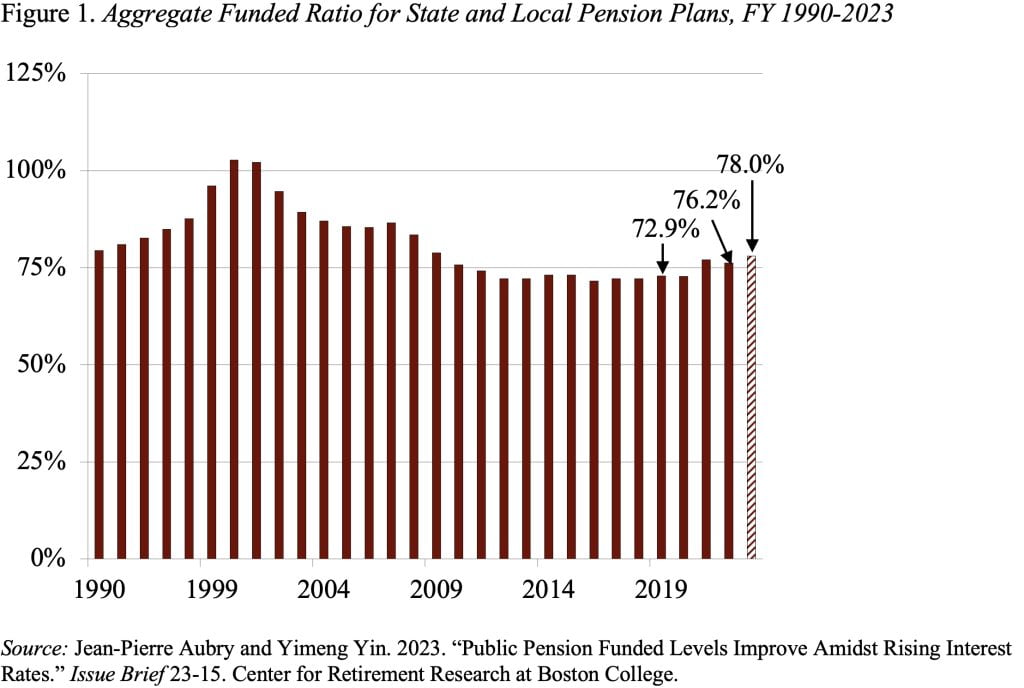
Despite the volatility of asset values over this period, the 2023 funded status of state and local pension plans is about 78 percent, which is 5 percentage points higher than in 2019 (see Figure 1). Of course, the numbers for 2023 are estimates based on plan-by-plan projections, but these projections have an excellent track record.
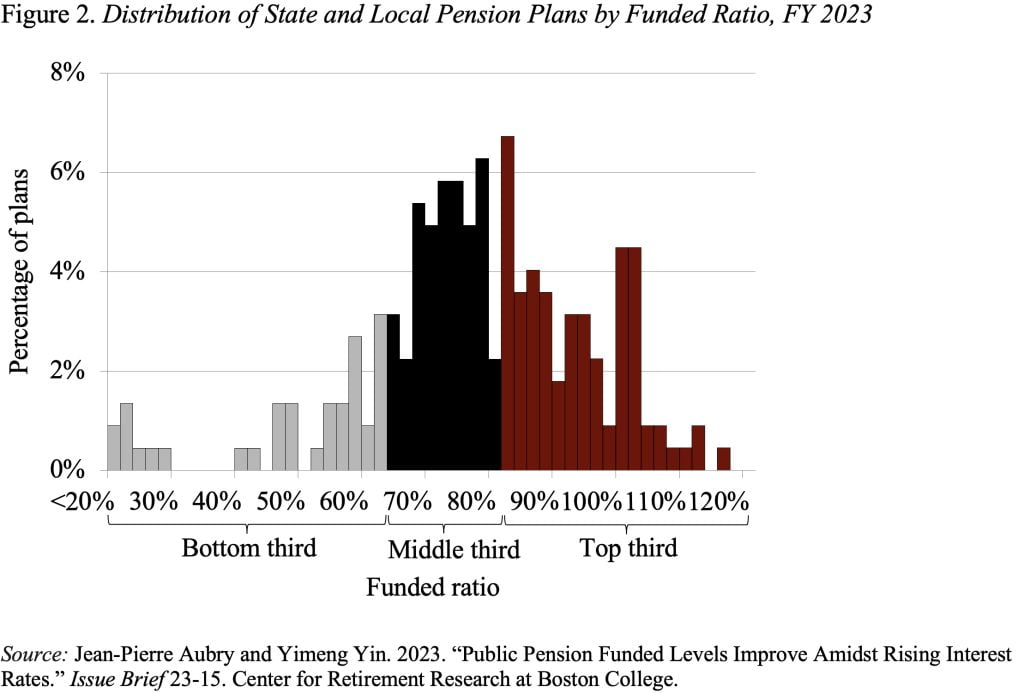
While the aggregate funded ratio provides a useful measure of the public pension landscape at large, it also can obscure variations in funding at the plan level. Figure 2 separates the plans into thirds based on their current actuarial funded status. The average 2023 funded ratio for each group was 57.6 percent for the bottom third, 79.5 percent for the middle third, and 91.1 percent for the top third.
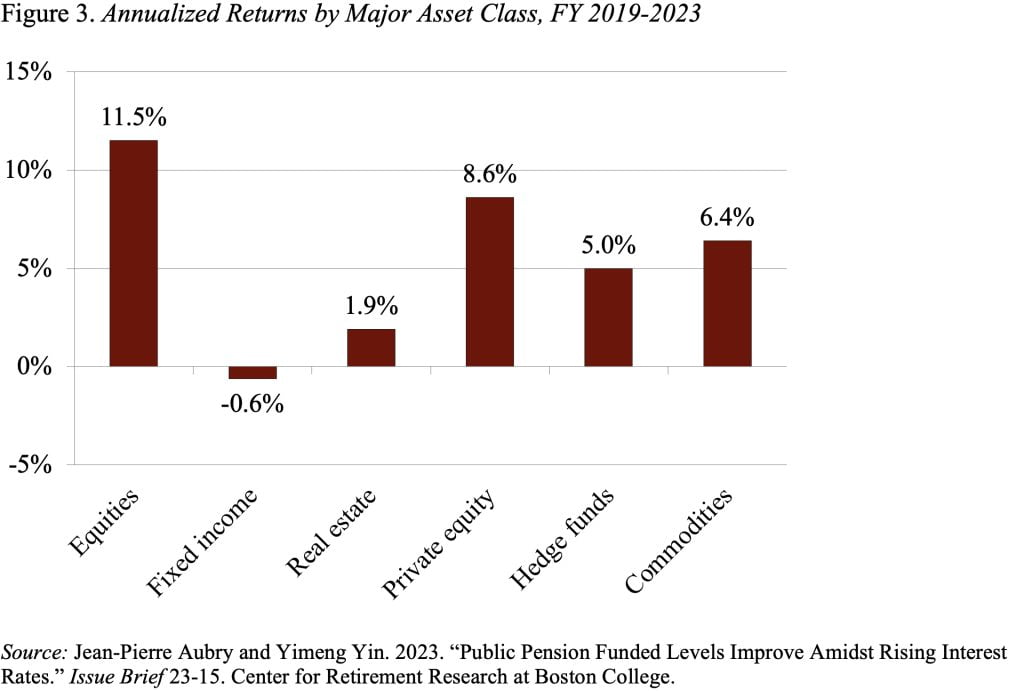
The major reason for the improvement in plans’ funded status is that, despite the turbulence in the economy, total annualized returns, which include interest and dividends, have risen noticeably for almost all major asset class indices over the 2019-2023 period (see Figure 3). The exception over this short and volatile period is fixed-income assets, which have declined in value.
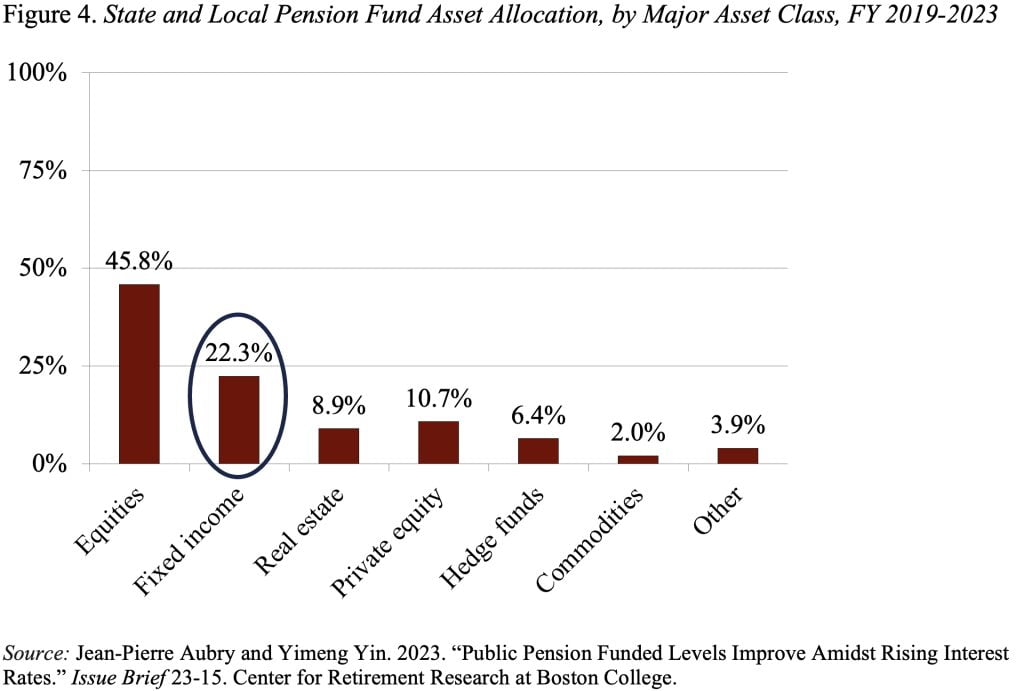
The effect of fixed income’s decline on overall portfolio performance has been modest because, since 2019, fixed income has averaged only about 20 percent of pension fund assets (see Figure 4).
So, things are looking a little better for state and local pensions. Yes, the funded ratios are biased upward because plans use the assumed return on their portfolios – roughly 7 percent – to discount promised benefits. That said, trends are important, and the trend is good.
Moreover, annual state and local benefit payments as a share of the economy are approaching their peak for two reasons. First, most pension plans do not fully index retiree benefits for inflation, which lowers the real value of benefits over time. Second, the benefit reductions for new hires – introduced in the wake of the Great Recession – have started to have an impact.
With liabilities in check and solid asset performance, maybe we can all relax a bit about the future of the state and local pension system.