
Social Security’s Financial Outlook: The 2025 Update in Perspective

The brief’s key findings are:
- The 2025 Trustees Report shows a modest increase in Social Security’s 75-year deficit, while the depletion date for the retirement trust fund remains at 2033.
- The prospect of a 23-percent benefit cut only 8 years away should focus our attention on restoring balance to the program.
- It’s important to note that these current estimates are based on the Trustees’ intermediate assumptions, which are not a sure thing.
- Indeed, the deficit could well end up higher if the fertility rate remains low, millions of immigrants are deported, and people live longer than expected.
- Even in this case, though, many revenue and benefit options are available to close the gap. All that is needed is the political will.
Introduction
Releasing the Social Security Trustees Report a couple of months later than usual always raises the intriguing question that it might include some titillating new information. For better or worse, the 2025 Trustees Report is standard fare. It confirms what has been evident for almost three decades – namely, Social Security is facing a 75-year financing shortfall that currently equals 1.3 percent of GDP. And, if no action is taken before 2033, the depletion of reserves in the retirement trust fund will result in an automatic 23-percent cut in benefits.
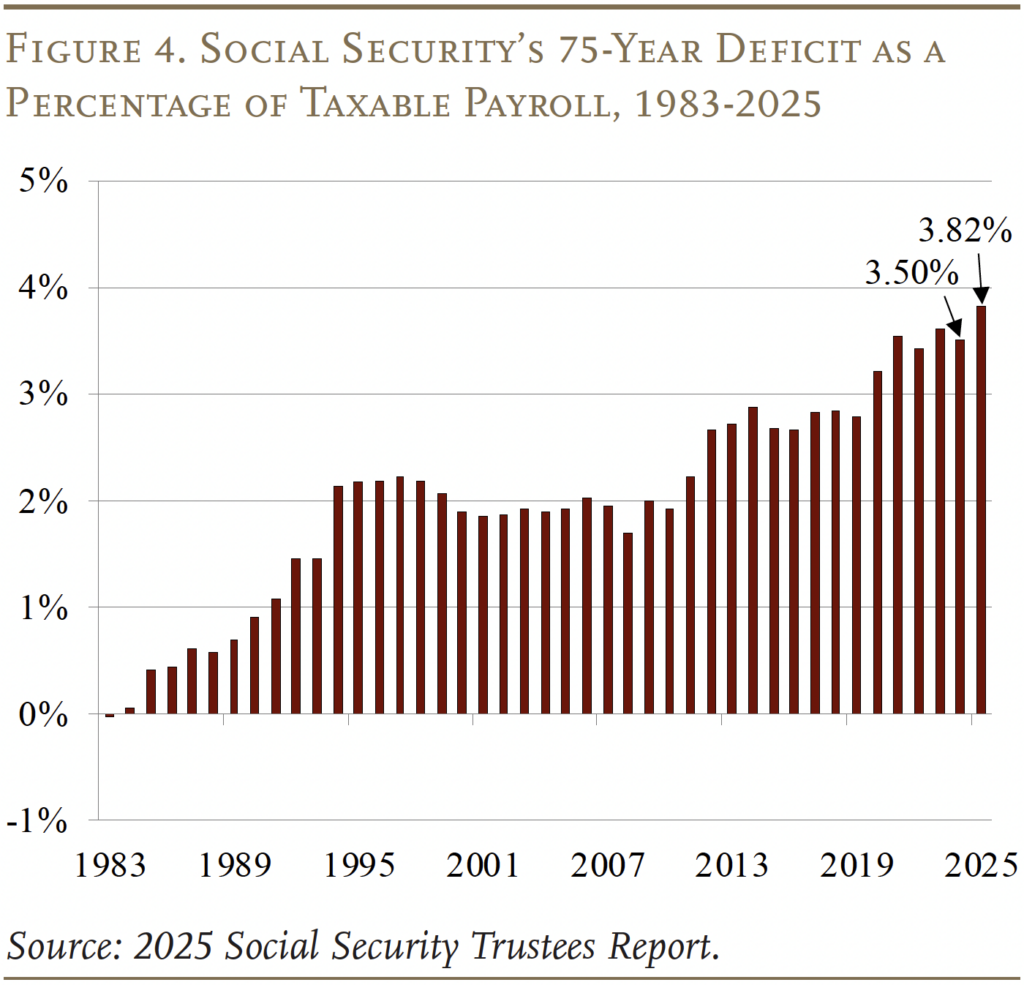
Compared to last year’s report, the metrics are somewhat worse. The projected 75-year deficit rose to 3.82 percent of taxable payroll, compared to 3.50 percent in 2024. The reasons were predictable: 1) the Social Security Fairness Act, enacted in January, raised benefits for some state and local workers; 2) the period of recovery from current low fertility rates was extended by 10 years to 2050; 3) the projection period moved forward, which replaces a low-deficit year with a high-deficit year; and 4) the share of GDP going to workers was revised downward, which reduces payroll tax revenues.
The projected depletion date for the Old-Age and Survivors Insurance (OASI) trust fund assets did not change; it remains at 2033. Yes, the Disability Insurance (DI) trust fund has enough to pay benefits for the full 75-year period, so the date of depletion for the combined OASDI trust funds is 2034 – a year earlier than last year’s report. But combining the two systems would require a change in the law; hence, under current law, the action-forcing date is 2033 – eight years from now.
This brief provides more detail on the numbers for 2025, using the Trustees’ intermediate assumptions. The intermediate scenario, however, is not a sure thing. Indeed, the Trustees present a sensitivity analysis for both the economic and demographic assumptions. Since the demographic assumptions show a high likelihood of breaking to the high-cost side, the discussion describes the cost to the program should the fertility rate remain low, should policymakers deport millions of immigrants and reduce future immigration levels, and should people live longer than expected.
The bottom line remains the same. Americans enthusiastically support the Social Security program; their representatives should fix its finances. Fixing Social Security sooner rather than later would keep more options open, distribute the burden more equitably across cohorts, and most importantly, restore confidence in the nation’s major retirement program.
The 2025 Report
Under the Trustees’ intermediate assumptions, the cost of the OASDI program rises rapidly from 15.2 percent of taxable payrolls today to 16.6 percent in 2040, drifts up to about 19.0 percent in 2080, and then declines slightly (see Figure 1).
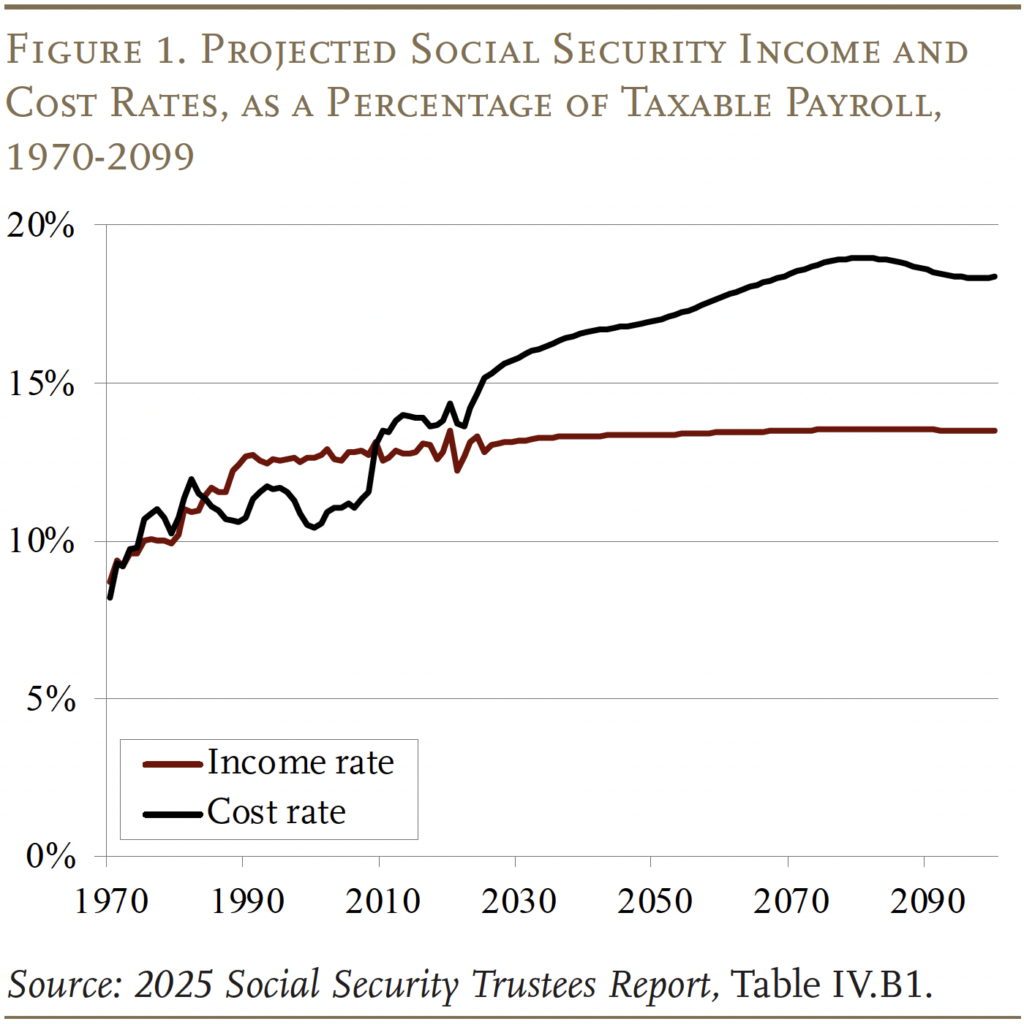
The increase in costs is driven by demographics, specifically the drop in the total fertility rate after the Baby Boom. Women of childbearing age in 1964 had an average of 3.2 children; by 1974 that number had dropped to 1.8. The combined effects of the retirement of Baby Boomers and a slow-growing labor force due to the decline in fertility reduce the ratio of workers to retirees, which raises costs. The gap between the income and cost rates means that the system is facing a 75-year deficit.
The 75-year cash flow deficit is mitigated in the short term by the assets in the trust fund, which currently equal about two years of benefits. These assets are the result of annual surpluses due to reforms enacted in 1983. Since 2010, however, when Social Security’s cost rate started to exceed the income rate, the government has been tapping the interest on trust fund assets to cover benefits. And, in 2021, as taxes and interest fell short of annual benefits, the government started to draw down trust fund assets. As noted in the introduction, these drawdowns will come to an end for OASI in 2033 when the trust fund is depleted.
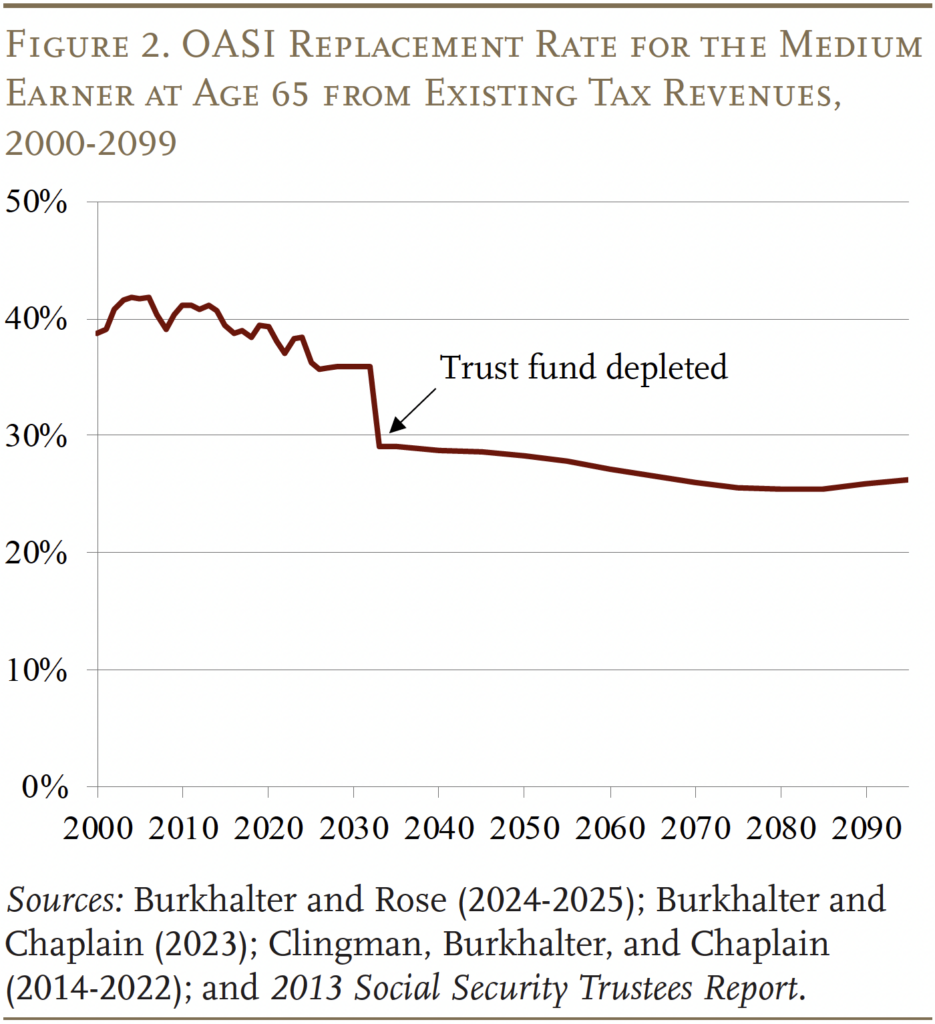
It is crucial to emphasize that the depletion of the trust fund does not mean that OASI has run out of money. At the time of the depletion, payroll tax revenues keep rolling in and can cover 77 percent of currently legislated benefits, declining to 69 percent by the end of the projection period. (If the OASI and DI trust funds were merged, the coverage numbers would be 81 percent, declining to 72 percent.) Relying only on current tax revenues, however, means that the replacement rate – retirement benefits relative to pre-retirement earnings – for the typical age-65 worker would drop immediately from about 36 percent to about 29 percent (see Figure 2). (Note that the replacement rate for those claiming at 65 has already declined due to the rise in the Full Retirement Age from 65 to 67.)
Moving from cash flows to the 75-year deficit requires calculating the difference between the present discounted value of scheduled benefits and the present discounted value of future revenues plus the assets in the trust fund. This calculation for the OASDI program shows that Social Security’s long-run deficit is projected to equal 3.82 percent of covered payroll earnings. That figure means that if payroll taxes were raised immediately by 3.82 percentage points – 1.91 percentage points each for the employee and the employer – the government could pay scheduled benefits through 2099, with a one-year reserve at the end.
At this point, solving the 75-year funding gap is not the end of the story in terms of required tax increases. In the future, once the ratio of retirees to workers stabilizes and costs remain relatively constant as a percentage of payroll, any solution that solves the problem for 75 years will more or less solve the problem permanently. But, during this period of transition, any package of policy changes that restores balance only for the next 75 years will show a 75-year deficit in the following year as the projection period picks up a year with a large negative balance. Thus, eliminating today’s 75-year shortfall should be viewed as the first step toward “sustainable solvency.”
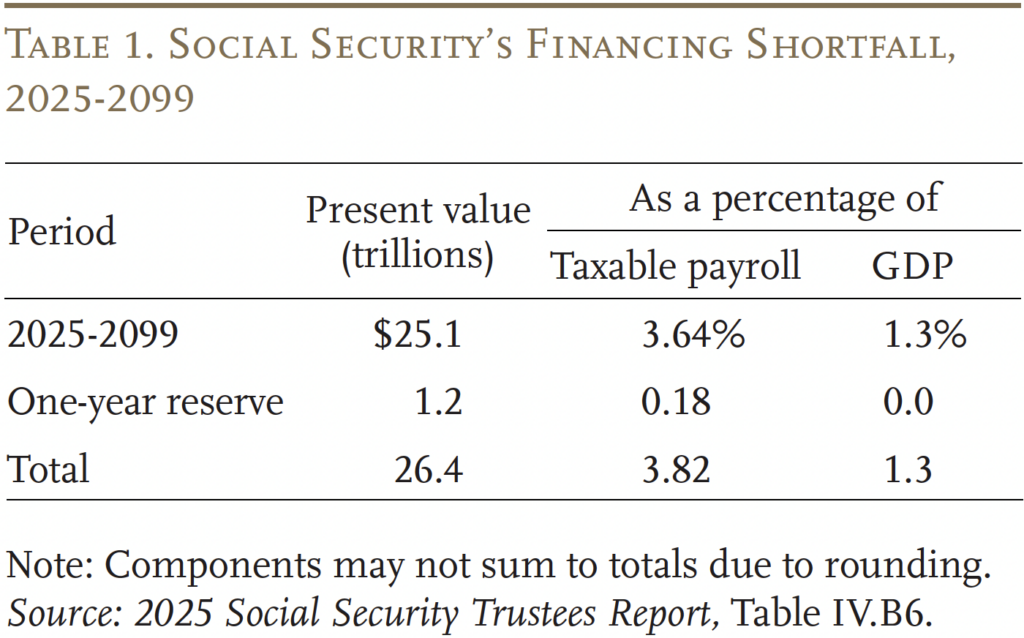
Some commentators cite Social Security’s financial shortfall over the next 75 years in terms of dollars – $25.1 trillion (see Table 1). Although this number appears very large, the economy – and, therefore, taxable payrolls – will also be growing. Thus, the scary $25.1 trillion can be eliminated – and a one-year reserve created – simply by raising the payroll tax by 3.82 percentage points.
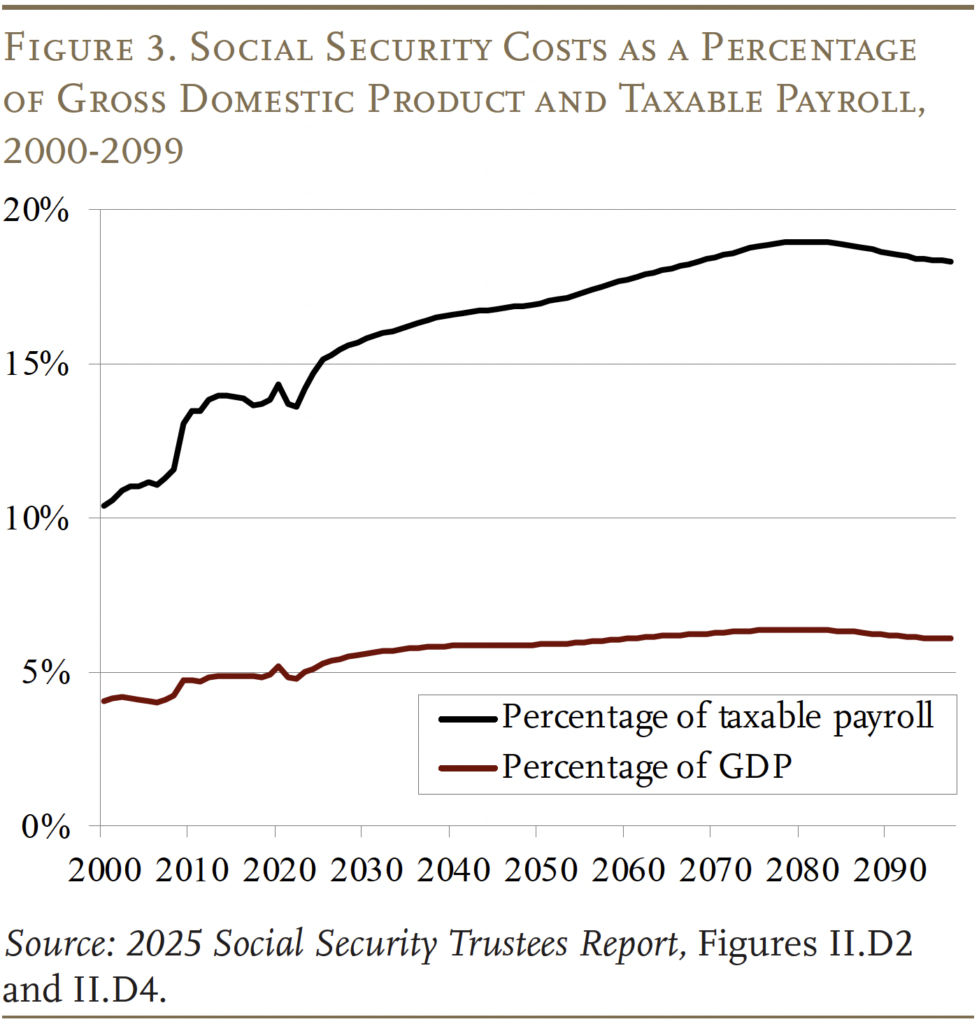
The Trustees also report Social Security’s shortfall as a percentage of GDP. The cost of the program is projected to rise from about 5 percent of GDP today to about 6 percent of GDP as the Baby Boomers retire (see Figure 3). The reason why costs as a percentage of taxable payroll keep rising – while costs as a percentage of GDP more or less stabilize – is that taxable payroll is projected to decline as a share of total compensation due to continued growth in health benefits.
2025 Report in Perspective
The 75-year deficits in the last five Trustees Reports are the largest since 1983 when Congress enacted major legislation to restore balance (see Figure 4). The main question is why did the deficit grow over the period 1983-2025, and a secondary question is why did it increase since last year’s Report.
Changes in 75-Year Deficit Since 1983
Social Security moved from a projected 75-year actuarial surplus of 0.02 percent of taxable payroll in the 1983 Trustees Report to a projected deficit of 3.82 percent in 2025. As shown in Table 2, leading the list of reasons is advancing the valuation period. Each time it moves out one year, it picks up a year with a large negative balance. The cumulative effect over the last 42 years has been to increase the 75-year deficit by 2.44 percent of taxable payrolls. That is, almost two-thirds of the 42-year change in the OASDI deficit is attributable to simply moving the valuation period forward.
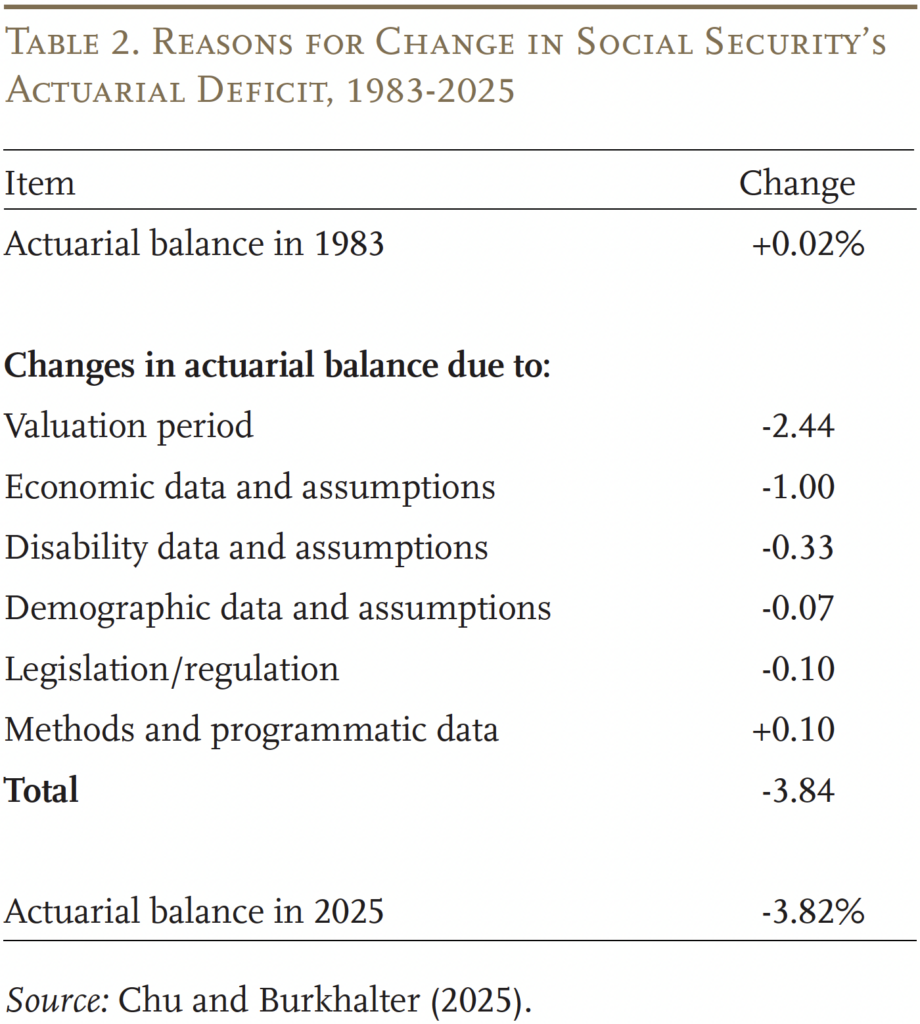
A worsening of economic assumptions – primarily a decline in assumed productivity growth and the impact of the Great Recession – have also contributed to the rising deficit. Another contributor over the past 42 years has been increases in disability rolls, although that picture has changed dramatically in recent years. Finally, changing demographic assumptions – most particularly, the reduction in the assumed fertility rate last year – has also added to the 42-year change. Partially offsetting the negative factors has been a reduction in the actuarial deficit due to methodological improvements and updated data. The net effect in 2025 of all these changes is a 75-year deficit equal to 3.82 percent of taxable payrolls.
Changes from Last Year’s Report
As noted earlier, the deficit of 3.82 percent of taxable payrolls in the 2025 Report is somewhat higher than the 3.50 percent in last year’s Report. This shift is primarily a result of four changes: the Social Security Fairness Act was enacted in January 2025; the valuation period moved forward one year; the projected ratio of labor compensation to GDP was reduced; and, buried in the demographic assumptions, the period of low fertility was extended (see Figure 5).
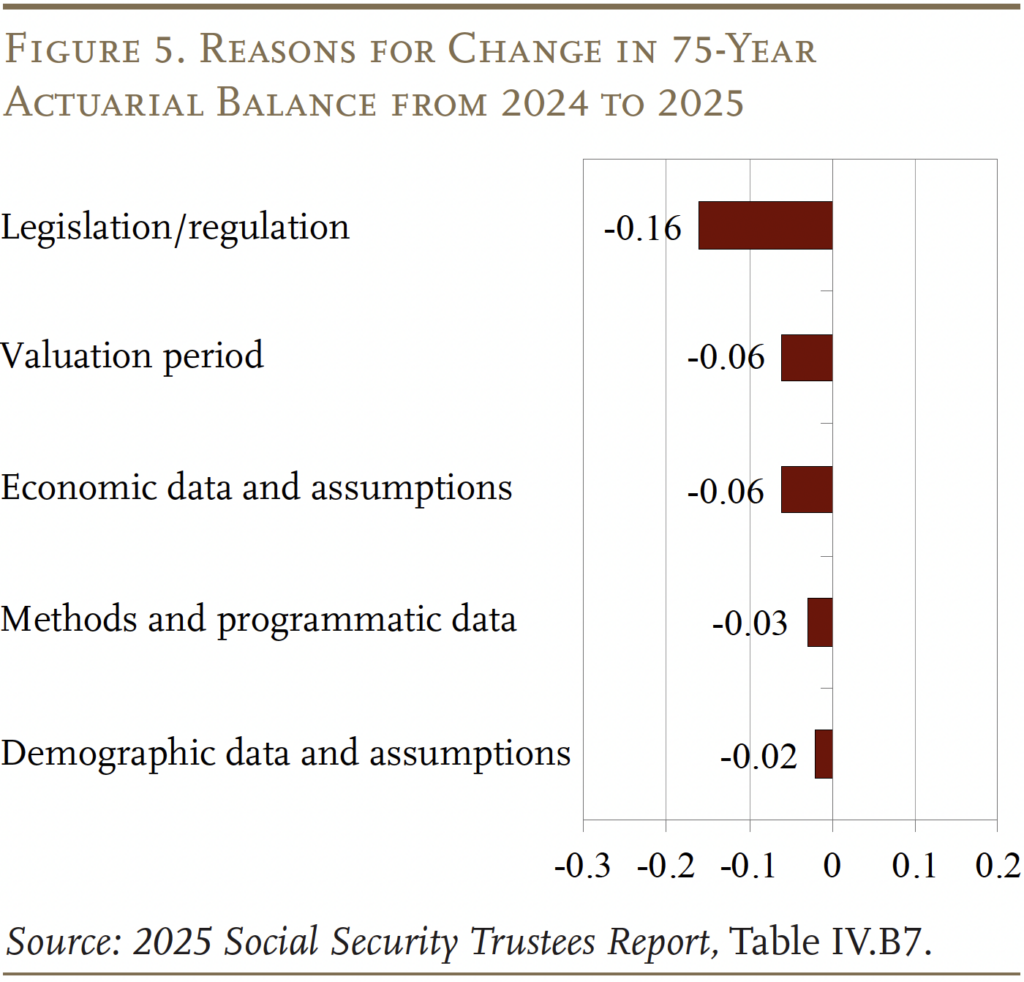
Legislation. The Social Security Fairness Act repealed provisions that were designed to ensure that state and local workers, who were not covered in their government job but gained minimum coverage through a second job, did not benefit unfairly from the progressivity of Social Security’s benefit formula or from benefits designed for non-working spouses. Yes, the adjustments could have been better designed – and they surely infuriated state and local workers – but they addressed a real equity issue. Eliminating the adjustments not only made the system less fair, but the higher benefits for these state and local workers cost the system money – worsening its financial situation in 2025 by 0.16 percent of taxable payroll.
Valuation period. The projection period for the 2025 Report is 2025-2099, compared to 2024-2098 for the previous year. The difference between the cost rate and the income rate in 2024 was -1.34 percent compared to -4.86 percent projected for 2099. Replacing the low-deficit year with a high-deficit year increases the 75-year shortfall by 0.06 percent.
Lower labor compensation/GDP. The ratio of total labor compensation to GDP over the last six complete economic cycles from 1969 to 2019 has averaged 0.62. The average ratio over the period 2020-2024 has been lower, however, and the Trustees slightly lowered their projection in 2025, reducing revenues slightly.
Demographics. This category is also of note because one component – extending the period of recovery from current low fertility rates by 10 years (from 2040 to 2050) – worsened the 75-year deficit by 0.11 between 2024 and 2025. This large negative effect, however, was largely offset by other positive changes, such as higher levels of immigration in the period 2022-2025, resulting in a modest net increase in the deficit of 0.02 percent of taxable payrolls.
Where Do We Go from Here?
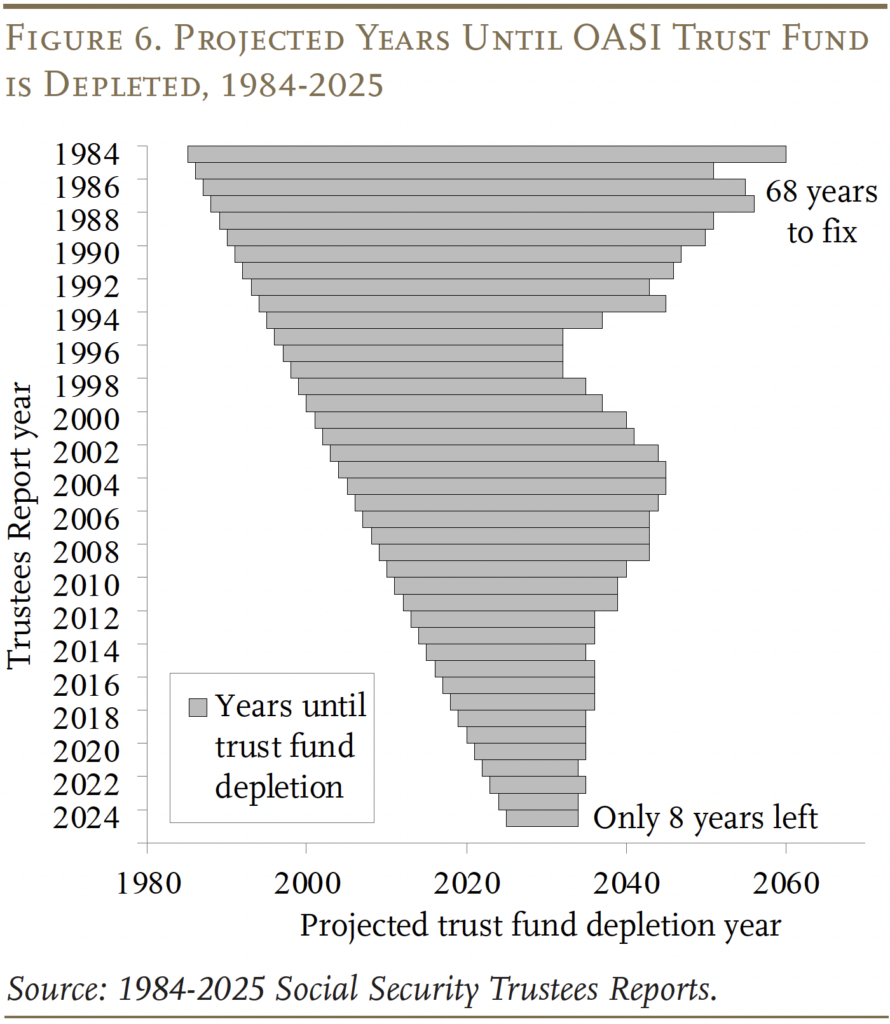
The 2025 Trustees Report shows that Congress has only eight years to act to avoid a 23-percent cut in retirement benefits (see Figure 6). If the law is changed so that Social Security’s OASI and DI trust funds are combined, reserves will be adequate to pay full benefits until 2034. As noted, to remain solvent with a one-year reserve, the payroll tax rate would have to be increased immediately by 3.82 percentage points. Alternatively, scheduled benefits would have to be reduced by 22.4 percent or by 26.8 percent if the reduction were applied only to those who become eligible in 2025 or later. A politically acceptable solution would likely involve some combination of revenue increases and benefit cuts.
All these estimates, however, are based on the Trustees’ intermediate assumptions. The problem is that the demographic assumptions – how many children we will have, how many immigrants we let in, and how long we will live – look quite optimistic given recent trends and political initiatives. Therefore, it is useful to take a look at the sensitivity analysis incorporated in the 2025 Report.
Sensitivity of 75-year Deficit to Alternative Demographic Assumptions
Demographic factors – fertility rates, immigration patterns, and mortality rates – are the biggest drivers of the cost of Social Security because they determine the number of workers paying into the system relative to beneficiaries collecting from the program. Although the Trustees present both high-cost and low-cost alternatives to their baseline assumptions, the risks appear to be primarily on the pessimistic side – that is, the costs reported in future years are likely to be higher than envisioned in the 2025 Report.
Impact of Total Fertility Rate
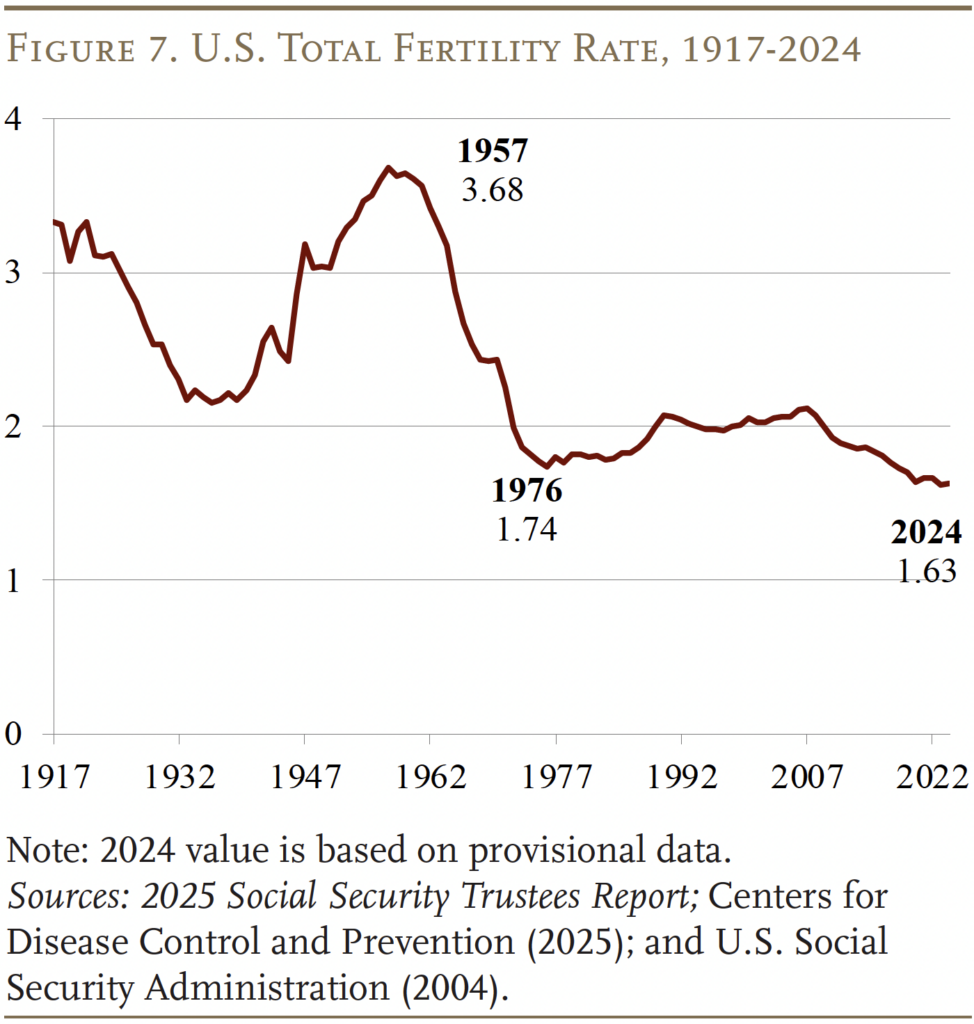
U.S. fertility rates have generally been falling since the end of the Baby Boom in the mid-1960s, and that decline accelerated after the Great Recession. Many observers thought that, once the economy recovered, the fertility rate would rebound. It has not (see Figure 7). Today, the hypothetical lifetime number of births for a woman over her childbearing years is 1.63, well below the level required to hold the population steady.
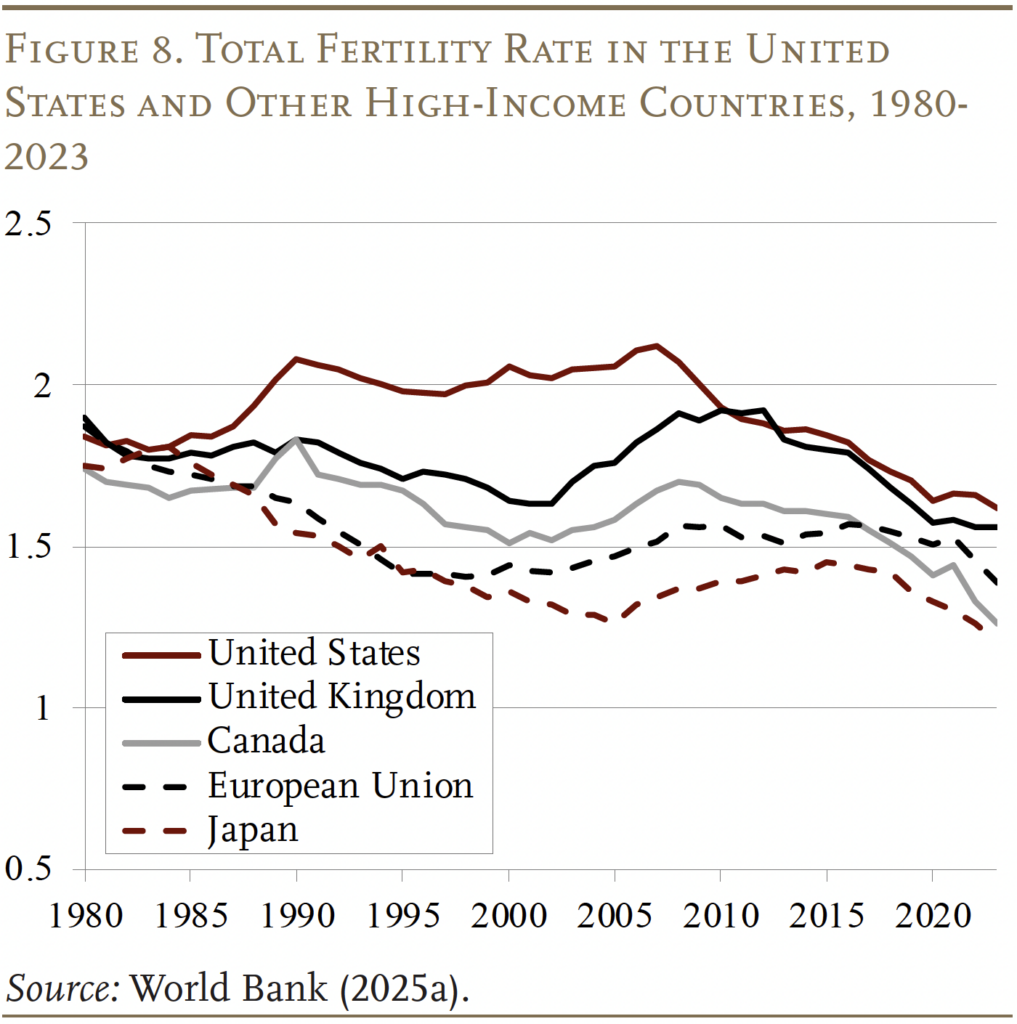
The U.S. current fertility rate is not an anomaly; it is now roughly in line with the rates in other high-income countries (see Figure 8). Part of the belated convergence between the United States and other countries reflects a dramatic decline in births among Hispanic women, some of which can be attributed to an increase in the native-born share of Hispanics and some of which may reflect the declining birth rate in originating countries, such as Mexico.
The Social Security Trustees are well aware of these numbers, but project an ultimate fertility rate of 1.9 children. The pattern incorporated in the 2025 projections is a gradual increase from today’s value to its ultimate value of 1.9 in 2050 (up from 2040 in last year’s report). The Trustees base their case on two factors. The first is that repeated surveys of women of childbearing age show birth expectations above 2.0, suggesting that the current low levels will not be permanent.1 Second, they believe that increasing fertility rates for women in their 30s support the notion that women are simply postponing their childbearing.
This Trustees’ projected fertility rate, however, is substantially higher than other government agencies. The Congressional Budget Office, in their 2025 projections, reach an ultimate total fertility rate of 1.60 by 2035.2 In the Census Bureau’s 2023 projections, the fertility rate decreases linearly from 2023 through 2100 and beyond.3 More specifically, the Census total fertility rate is 1.60 in 2050 and 1.55 in 2100.
Additionally, the most recent expectations data – which came out after the Trustees set their assumptions for this year’s report – show that women under 35 all expect to have fewer than 2.0 children.4 In fact, today’s 20-24-year-olds only expect to have 1.5 children, while 25-29-year-olds expect to have 1.9 children.
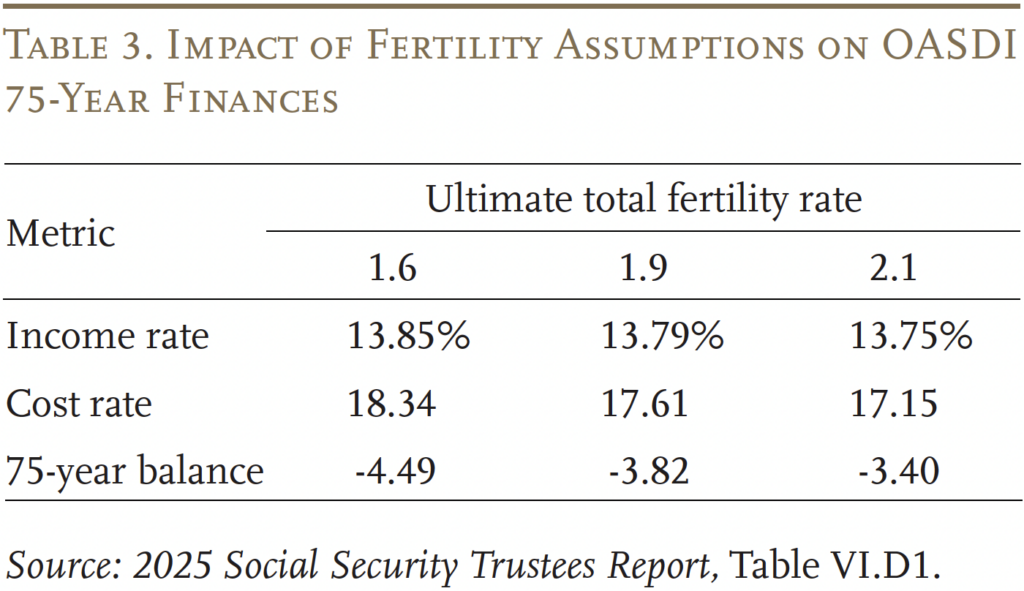
If low fertility persists, the cost of the Social Security program will be higher over the next 75 years than reported in the 2025 report. According to the Trustees’ sensitivity analysis, an ultimate fertility rate of 1.6 rather than 1.9 would increase the 75-year deficit from 3.82 to 4.49 percent of taxable payroll (see Table 3). Since an increase in the fertility rate would not affect the labor force for about 20 years, lower fertility rates would have no impact on the depletion of OASDI assets.
Could pro-natalist policies increase the fertility rate? President Trump has called for a new “baby boom,” suggesting steps such as a $5,000 cash “baby bonus” to every American mother.5 The challenge is that, over the last 30 years, many countries have instituted pro-natalist policies – basing benefits on number of children, providing allowances for newborns, or offering child tax credits. The evidence suggests that these efforts have not worked.6 Sweden is a wonderful example because, even with soup-to-nuts support, its fertility rate is 1.45 – significantly lower than the U.S. rate.7
The important thing to remember is that producing our own babies is not the only alternative; increasing immigration is a direct way to raise the worker-to-retiree ratio and improve the finances of Social Security. The problem is that we seem to be moving in the wrong direction.
Impact of Immigration
Future patterns of immigration are notoriously difficult to predict; flows depend on economic and political conditions in both the emigrant country and the United States. The task here, however, is much simpler – assessing how the projected patterns could be affected by both current and future Administrations’ attitude towards immigrants and immigration.
Social Security’s immigration projections involve estimating net flows for two types of immigrants – lawful permanent residents and those present temporarily or unlawfully. Temporary/unlawful immigrants include those who entered legally but were only granted temporary authorization (such as students and foreign workers on visas) and those who overstayed their visas, as well as those who entered illegally.
In the 2025 Report, total annual immigration for the two groups – under the intermediate assumptions – averages 1,253,000 for the period 2035 through 2099. Of the total, 788,000 are lawful permanent residents and 465,000 are temporary/unlawful immigrants. The ultimate level of immigration assumptions remained unchanged from last year’s Report. The Social Security projections are fairly consistent with those from other federal agencies.8
As with other assumptions, the Trustees present both a more optimistic (lower cost) and more pessimistic (higher cost) projection for immigration (see Table 4). Additional immigration helps Social Security finances in several ways. First, the cost rate decreases because immigration occurs at relatively young ages, thereby – at least in the short run – lowering the ratio of retirees to workers. Second, temporary/illegal immigrants often contribute to Social Security, but do not qualify for benefits.9 Third, immigrants tend to have more babies than native-born Americans, thereby raising the domestic fertility rate, which further improves the outlook.
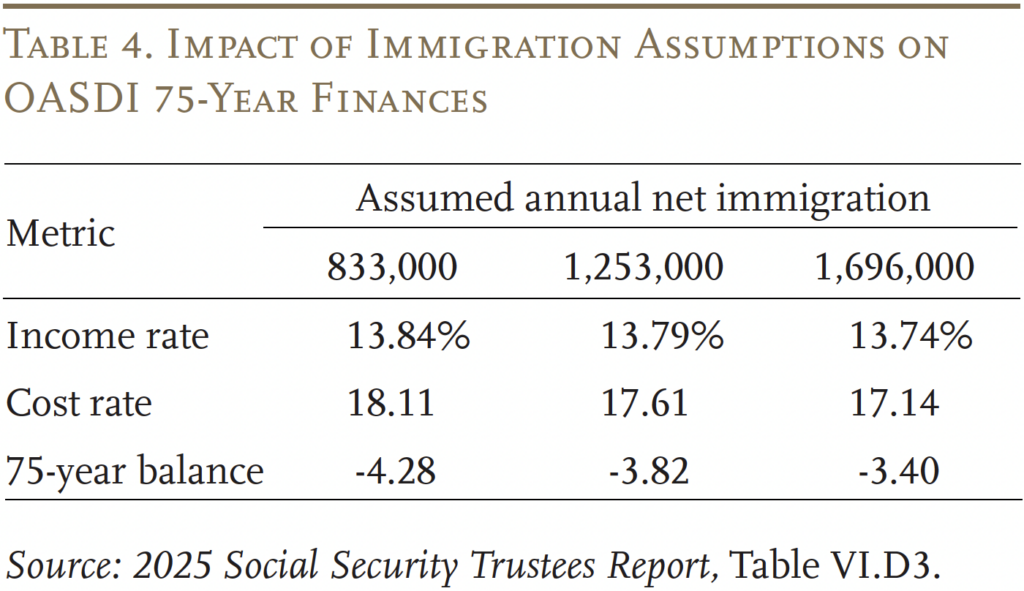
The Administration’s policy is to eliminate all illegal immigration, and its actions – such as, barring foreign students – will likely lead to less legal immigration. If future immigration flows end up closer to the pessimistic assumptions, the 75-year actuarial deficit would look closer to 4.28 percent of taxable payrolls than 3.82 percent.
In addition to reducing the flows of future immigrants, President Trump campaigned on deporting 15 to 20 million illegal immigrants currently in the United States.10 Recent research from the Pew Research Center and other scholars puts the number of immigrants here illegally at closer to 11 million.11 Nevertheless, should such an effort succeed, it would increase the number of beneficiaries per worker. The higher cost rate would further raise the 75-year deficit, and the immediacy of the impact would accelerate the depletion of the trust fund by about a year.12
Impact of Mortality
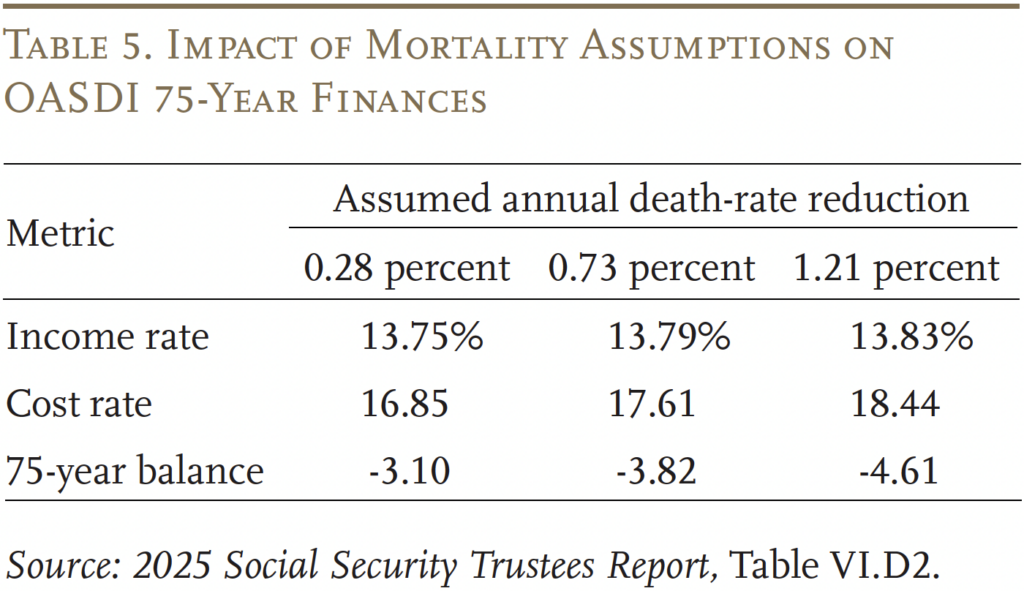
That mortality assumptions would be important is intuitive, since the longer people live – given the current Full Retirement Age – the more expensive the program. Mortality, however, differs from the previous two factors along two dimensions. First, while the number of expected births is an easy-to-understand metric for fertility and net flows of people into the country for immigration, the metric for mortality is more convoluted. Death rates are generally declining, and the assumption centers on the rate at which the death rate is projected to decline. If the rate of decline is faster than the intermediate assumption, people will live longer; if it slows down, people will die sooner. The Trustees estimate that a higher rate of decline could raise the 75-year deficit from 3.82 to 4.61 percent of taxable payrolls; slower mortality improvement would lower the 75-year deficit to 3.10 (see Table 5). The possible range of outcomes for mortality is larger than that for fertility or immigration.
The second dimension in which the discussion of mortality differs from fertility and immigration is the desirability of a low-cost outcome. One can be happy if women decide to have more babies or if the United States attracts more talented immigrants, but it is hard to argue for people dying earlier. That said, it is still useful to speculate about whether the future path of mortality will break to the high-cost or low-cost side. Two pieces of evidence suggest that the actual outcome could result in a higher rate of mortality improvement than suggested by the Trustees’ intermediate assumptions.
First, comparisons show that the Social Security mortality assumptions result in a slightly lower life expectancy than other government entities. The Congressional Budget Office’s mortality assumptions result in life expectancy at birth of 82.3 years in 2055 – the end of their projection period. In the Census 2023 projections, the assumed mortality rates result in a life expectancy at birth of 83.7 years in 2055. In contrast, the Trustees assumptions’ result in a life expectancy at birth of 82.0 years in 2055.
Second, comparisons with other developed countries also suggest substantial room for a major improvement in U.S. life expectancy (see Figure 9). Life expectancy at birth in the United States and other high-income countries has increased dramatically over the last 40 years. But progress in the United States has been slower than its peers, and the U.S. ranking has dropped from the middle of the group to the absolute bottom. Historically, two contributors to this poor performance have been deaths linked to smoking and obesity.13 Smoking has faded as an issue, but obesity remains important. To the extent that the new weight loss drugs become widely available, the United States might regain its position among other developed nations.14 In short, projections of future life expectancy may break to the high side – raising the cost of the Social Security program.
Summary
The previous discussion is not a critique of the Trustees’ assumptions but rather an effort to highlight the uncertainty that surrounds any projections made for the next 75 years and to identify factors that may make the high-cost alternatives more likely than the intermediate estimates. These developments – combined with the annual increase in the deficit as the evaluation period shifts forward – means that Trustees Reports in the next few years may well show 75-year deficits in the range of 4.0 to 4.5 percent. Even with higher projected deficits, the levers are available on both the revenue and benefit side to restore balance. Congress just needs to act.
Conclusion
The 2025 Trustees Report confirms what has been evident for almost three decades – namely, Social Security is facing a long-term financing shortfall that equals about 1 percent of GDP. The changes required to fix the system are well within the bounds of fluctuations in spending on other programs in the past. Moreover, action needs to be taken before the OASI trust fund is depleted in 2033 to avoid a precipitous cut in benefits.
This brief also draws attention to the fact that all the public discussion about Social Security focuses on numbers based on the Trustees’ intermediate assumptions. The intermediate scenario, however, is not a sure thing. Indeed, the Trustees present a sensitivity analysis for both the economic and demographic assumptions. Since the demographic assumptions show a high likelihood of breaking to the high-cost side, the discussion describes the cost to the program should the fertility rate remain low, should policymakers deport millions of immigrants and reduce future immigration levels, and should people live longer than expected. Even if the hole turns out to be somewhat larger than currently estimated, numerous options are available on both the revenue and benefit sides to close the gap. All that is needed is the political will.
References
Brainerd, Elizabeth. 2014. “Can Government Policies Reverse Undesirable Declines in Fertility?” IZA World of Labor 2014: 23.
Burkhalter, Kyle and Karen Rose. 2024-2025. “Replacement Rates for Hypothetical Retired Workers.” Actuarial Note Number 9. Baltimore, MD: U.S. Social Security Administration.
Burkhalter, Kyle and Chris Chaplain. 2023. “Replacement Rates for Hypothetical Retired Workers.” Actuarial Note Number 9. Baltimore, MD: U.S. Social Security Administration.
Centers for Disease Control and Prevention, National Vital Statistics System. 2025. “Birth: Provisional Data for 2024.” Report No. 38. Atlanta, GA.
Chen, Anqi, Alicia H. Munnell, Geoffrey T. Sanzenbacher, and Alice Zulkarnain. 2017. “Why Has U.S. Life Expectancy Fallen Below Other Countries?” Issue in Brief 17-22. Chestnut Hill, MA: Center for Retirement Research at Boston College.
Chu, Sharon and Kyle Burkhalter. 2025. “Disaggregation of Changes in the Long-Range Actuarial Balance for the Old Age, Survivors, and Disability Insurance (OASDI) Program Since 1983.” Actuarial Note Number 8. Baltimore, MD: U.S. Social Security Administration.
Clingman, Michael, Kyle Burkhalter, and Chris Chaplain. 2014-2022. “Replacement Rates for Hypothetical Retired Workers.” Actuarial Note Number 9. Baltimore, MD: U.S. Social Security Administration.
Congressional Budget Office. 2025. The Demographic Outlook: 2025 to 2055. Washington, DC.
Demissie, Hannah and Katherine Faulders. 2025. “Trump Administration Looking at $5,000 ‘Baby Bonus’ to Incentivize Public to Have More Children.” (April 23). New York, NY: ABC News.
Desilver, Drew. 2024. “As Obesity Rates Rise in the U.S. and Worldwide, New Weight-Loss Drugs Surge in Popularity.” Short Reads. Washington, DC: Pew Research Center.
Duleep, Harriet Orcutt, Dave Shoffner, Robert Gesumaria, and Christopher R. Tamborini. 2025. “Measuring the Number of Unauthorized Immigrants in the United States: A Review of the Residual Estimation Method.” Social Security Bulletin 85(2): 1-8.
Gesumaria, Robert, Harriet Orcutt Duleep, Christopher R. Tamborini, and Dave Shoffner. 2025. “A New Way to Estimate the Number of Unauthorized Immigrants in the United States.” Social Security Bulletin 85(2): 17-23.
Hays, Jake. 2025. “U.S. Adults in Their 20s and 30s Plan to Have Fewer Children than in the Past.” Short Reads. Washington, DC: Pew Research Center.
Kearney, Melissa S. and Phillip B. Levine. 2022. “The Causes and Consequences of Declining US Fertility.” In Economic Policy in a More Uncertain World, edited by Melissa S. Kearney and Amy Ganz. Washington, DC: Aspen Institute.
Passel, Jeffrey S. and Jens Manuel Krogstad. 2024. “What Do We Know About Unauthorized Immigrants Living in the U.S.?” Short Reads. Washington, DC: Pew Research Center.
Shin, Sophie. 2025. “The Impact of President Trump’s Deportation Policies: The Social Security Program.” Penn Wharton Budget Model Brief. Philadelphia, PA: The University of Pennsylvania, Wharton School.
Sobotka, Tomáš, Anna Matysiak, and Zuzanna Brzozowska. 2019. “Policy Responses to Low Fertility: How Effective Are They?” Working Paper 1. New York, NY: United Nations Population Fund.
Tamborini, Christopher R., Harriet Orcutt Duleep, Robert Gesumaria, and Dave Shoffner. 2025. “Measuring the Economic and Sociodemographic Characteristics of Unauthorized Immigrants in the United States with Survey Data.” Social Security Bulletin 85(2): 9-15.
Time. 2024. “Read the Full Transcripts of Donald Trump’s Interviews With TIME.” (April 30). New York, NY.
U.S. Census Bureau. 2025. 2023 National Population Projections Datasets. Washington, DC.
U.S. Social Security Administration. 1983-2025. The Annual Reports of the Board of Trustees of the Federal Old-Age and Survivors Insurance and Federal Disability Insurance Trust Funds. Washington, DC: U.S. Government Printing Office.
U.S. Social Security Administration. 2025b. The Long-Range Demographic Assumptions for the 2025 Trustees Report. Washington, DC: U.S. Government Printing Office.
U.S. Social Security Administration. 2004. “A Stochastic Model of the Long-Range Financial Status of the OASDI Program.” Actuarial Study No. 117. Baltimore, MD: Office of the Chief Actuary.
World Bank. 2025a. “World Development Indicators: Fertility Rate, Total (Births per Woman).” Washington, DC.
World Bank. 2025b. “World Development Indicators: Life Expectancy at Birth, Total (Years).” Washington, DC.
Endnotes
- U.S. Social Security Administration (2025b). ↩︎
- Congressional Budget Office (2025). ↩︎
- U.S. Census Bureau (2025). ↩︎
- Hays (2025) using data from the National Survey of Family Growth. ↩︎
- Demissie and Faulders (2025). ↩︎
- Kearney and Levine (2022); Sobotka, Matysiak, and Brzozowska (2019); and Brainerd (2014). ↩︎
- World Bank (2025a). ↩︎
- In their 2025 projections, the Congressional Budget Office projects total net immigration of 1.1 million people per year, on average, for the period 2027-55. In the Census 2023 projections, total net immigration increases from 853,000 in 2023 to 944,000 in 2100, averaging 908,000 per year for the period 2025-55. In comparison, the intermediate assumptions in the 2025 Trustees Report produce average annual net immigration of 1.3 million for the period 2025-55. ↩︎
- Assuming no change in immigration status, illegal
immigrants never qualify for benefits, while temporary
immigrants with authorized work status could
qualify for benefits in rare cases. ↩︎ - Time (2024). ↩︎
- Passel and Krogstad (2024); Duleep et al. (2025); Tamborini et al. (2025); and Gesumaria et al. (2025). ↩︎
- An upper-bound estimate that assumes all 11 million undocumented immigrants were deported immediately and earned average wages would increase the number of beneficiaries per 100 workers from 38 to 40 and immediately raise the cost rate by 5 percent, moving the trust fund depletion date up by about two years to 2032. The Wharton Penn Budget model estimate, which assumes undocumented immigrants are deported over 10 years and earn one-third of the average wage, would accelerate trust fund depletion by three months (see Shin 2025). ↩︎
- See Chen et al. (2017). ↩︎
- Desilver (2024). ↩︎


Munnell, Alicia H.. 2025. "Social Security's Financial Outlook: The 2025 Update in Perspective" Issue in Brief 25-14. Chestnut Hill, MA: Center for Retirement Research at Boston College.