
State and Local Pension Plans Have Gained Nothing from Complex Investing

Alicia H. Munnell is a columnist for MarketWatch and senior advisor of the Center for Retirement Research at Boston College.
They would improve transparency and most likely returns by investing in index funds.
I must admit, I love it when research supports my gut. Hence, I am delighted to report the findings from the new study by my colleagues JP Aubry and Yimeng Yin that compares actual returns earned by state and local pension plans with returns from a simple index portfolio of 60 percent US stocks (Russell 3000 Total Return Index) and 40 percent US bonds (Bloomberg US Aggregate Bond Index), with a 10-basis point management fee.
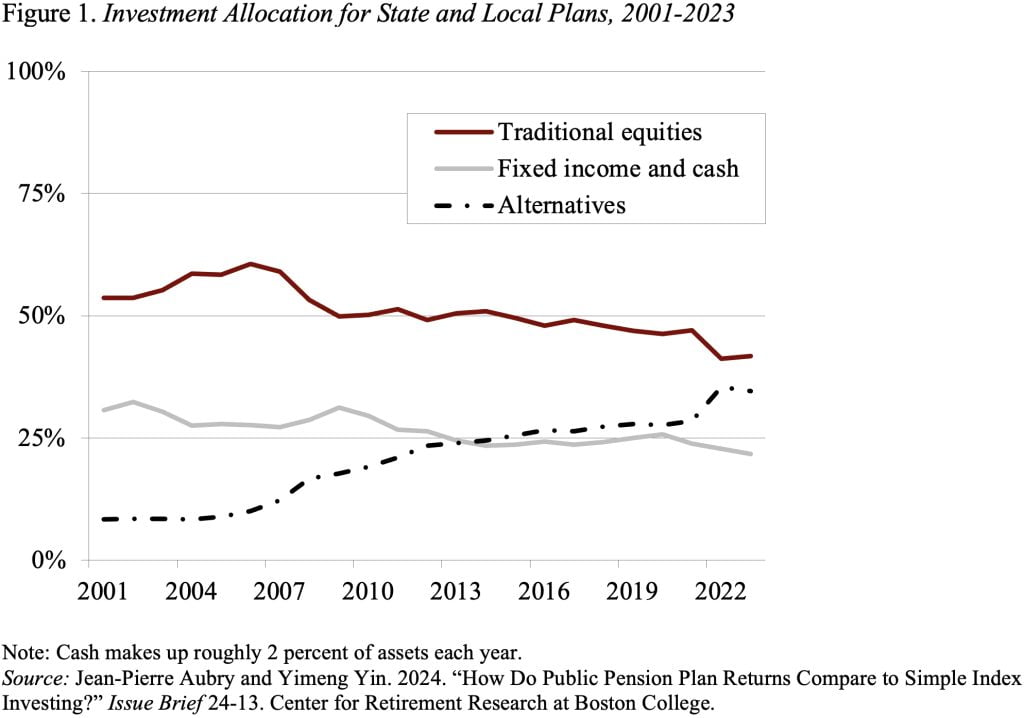
The performance issue has arisen because state and local plans have been shifting their portfolios from traditional equities and bonds to alternative assets, such as private equities, hedge funds, real estate, and commodities (see Figure 1).
JP and Yimeng are not the first researchers to compare actual returns for state and local plans to a simple indexed approach. A number of recent studies have shown that public plans in aggregate underperform index portfolios by 0.9 percent to 1.6 percent annualized (see Table 1).
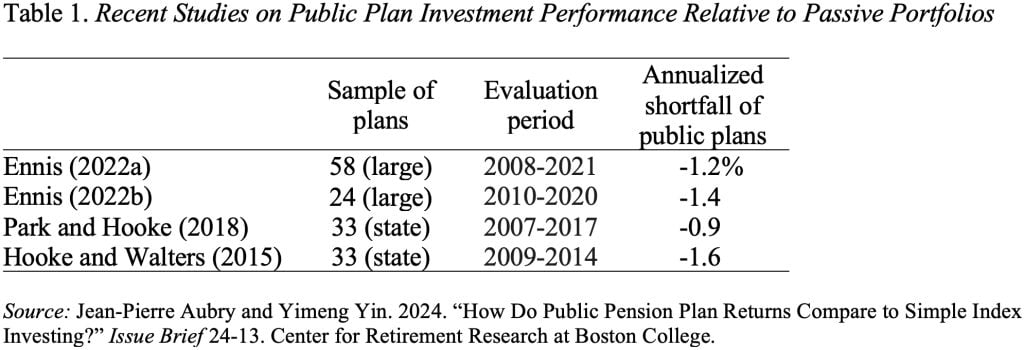
Critics counter that the findings to date, however, depend heavily on the time period analyzed. Further complicating the discussion is pension funds’ use of lagged returns for some alternative assets, which can distort their overall reported return.
To address these concerns, JP and Yimeng compare actual returns to the 60/40 approach over various time periods, using pension returns adjusted for lagged reporting.
The first takeaway from their new study is that, as shown in Figure 2, the long-term annualized return for pension funds is almost the same as that of the 60/40 portfolio (about 6.1 percent for both).
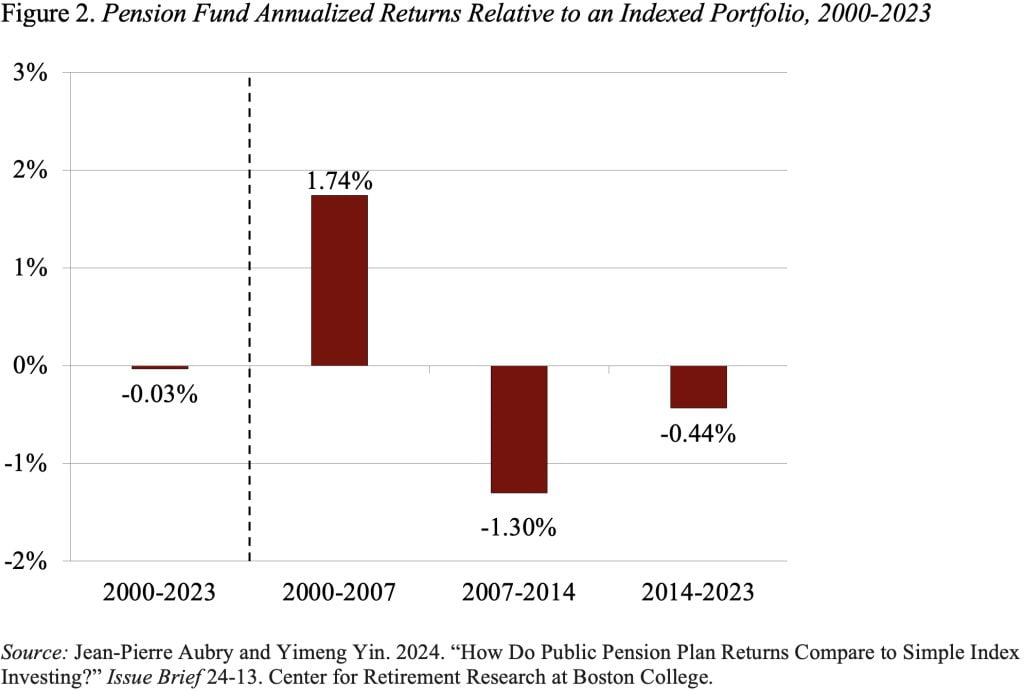
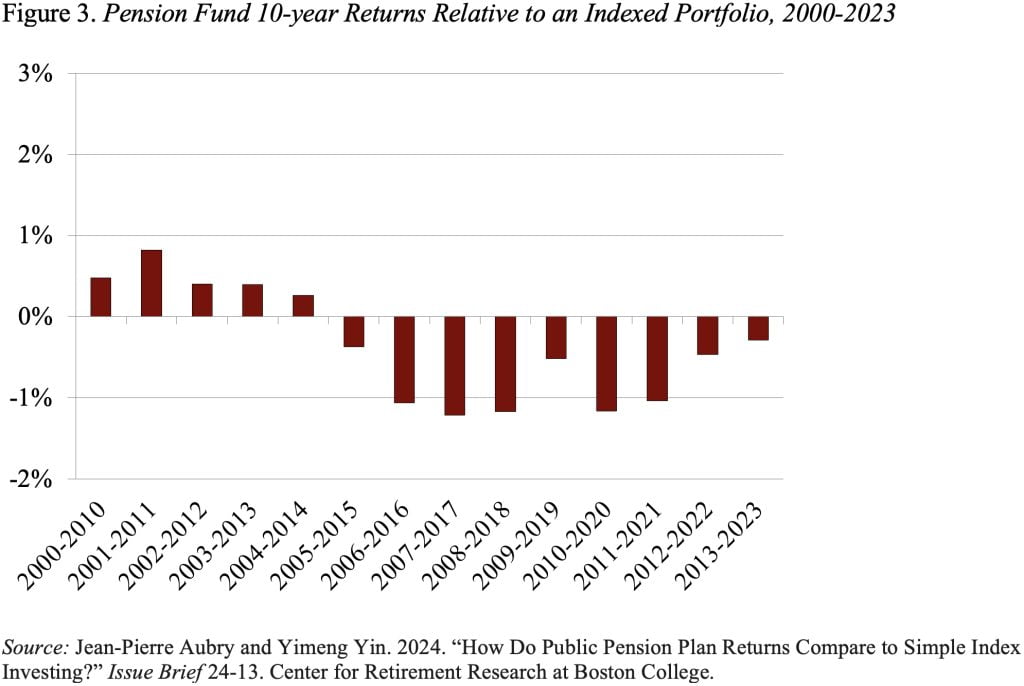
However, the results also reveal an interesting two-part story underlying this similar performance – state and local plans did much better than the index funds before the Global Financial Crisis and much worse post-crisis. This pattern also shows up in Figure 3, which compares performance over each 10-year period between 2000 to 2023.
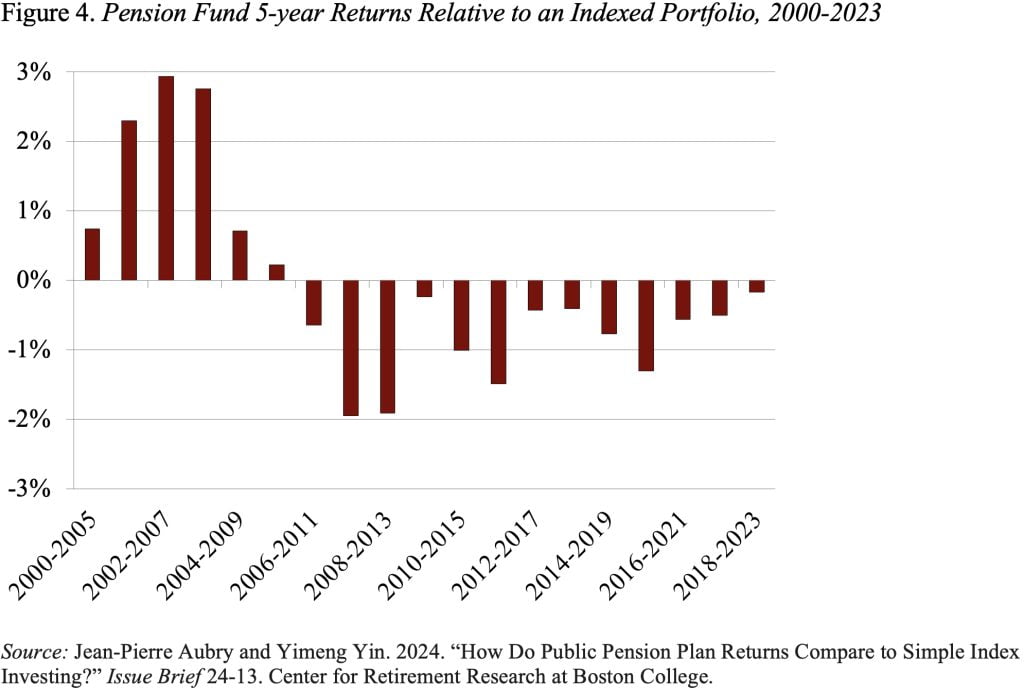
Finally, the authors presented results for each 5-year period between 2000 and 2023. Again, the overall results are similar (see Figure 4). State and local plans did better through 2010 and have fallen short each period afterward.
The clear message from this research is that state and local plans cannot reasonably anticipate extraordinary long-term returns from an opaque strategy involving complex assets and active management. In such a world, public plans should probably stick to a transparent approach of simple index funds.