
What Are the Implications of Rising Debt for Older Americans?

The brief’s key findings are:
- The share of older Americans with debt has been rising since the 1990s, but holding debt in retirement is not necessarily bad.
- The question is, how many older borrowers are at high risk of financial distress due to the type and size of their debt?
- The analysis finds that the majority of older borrowers are at high risk, but not all high-risk borrowers are alike.
- The high-risk fall into four groups: 1) financially constrained; 2) credit card borrowers; 3) too much house; and 4) wealthy spenders.
- Hence, no one-size-fits-all solution exists, so targeted policy interventions would be most effective.
Introduction
The share of older Americans with debt has been on the rise over the last several decades. Having debt, however, does not always signal financial fragility because debt can be used for various purposes. For example, households that take out a low-interest mortgage to buy a home, which typically appreciates in value, are likely making a savvy choice. In contrast, households that carry unpaid credit card balances could see their debt snowball, leading to financial distress. Identifying these distinctions in household debt situations is crucial to understanding the implications of the rise in debt holding among seniors.
This brief, based on a new paper, addresses three key questions: 1) As more older households carry debt in retirement, what share are at “high-risk” and “low-risk” of financial hardship? 2) Is the growth in debt holding driven by the high- or low-risk households? and 3) What are the different types of high-risk households?1Chen, Liu, and Munnell (2023). The answers will help policymakers determine which types of borrowers are most vulnerable and develop tailored solutions for assisting them.
The discussion proceeds as follows. The first section provides background on trends in debt holding among older Americans. The second section sorts households into high-risk and low-risk based on their debt and asset profiles, and it shows that high-risk borrowers are driving the growth in debt. The third section identifies four groups of high-risk borrowers with very different characteristics. Given the diverse situations of high-risk borrowers, the fourth section suggests some potential ways to address each group’s specific needs. The final section concludes that the debt burdens of high-risk borrowers are cause for concern, but a one-size-fits-all solution does not exist, so targeted interventions would be most effective.
Background
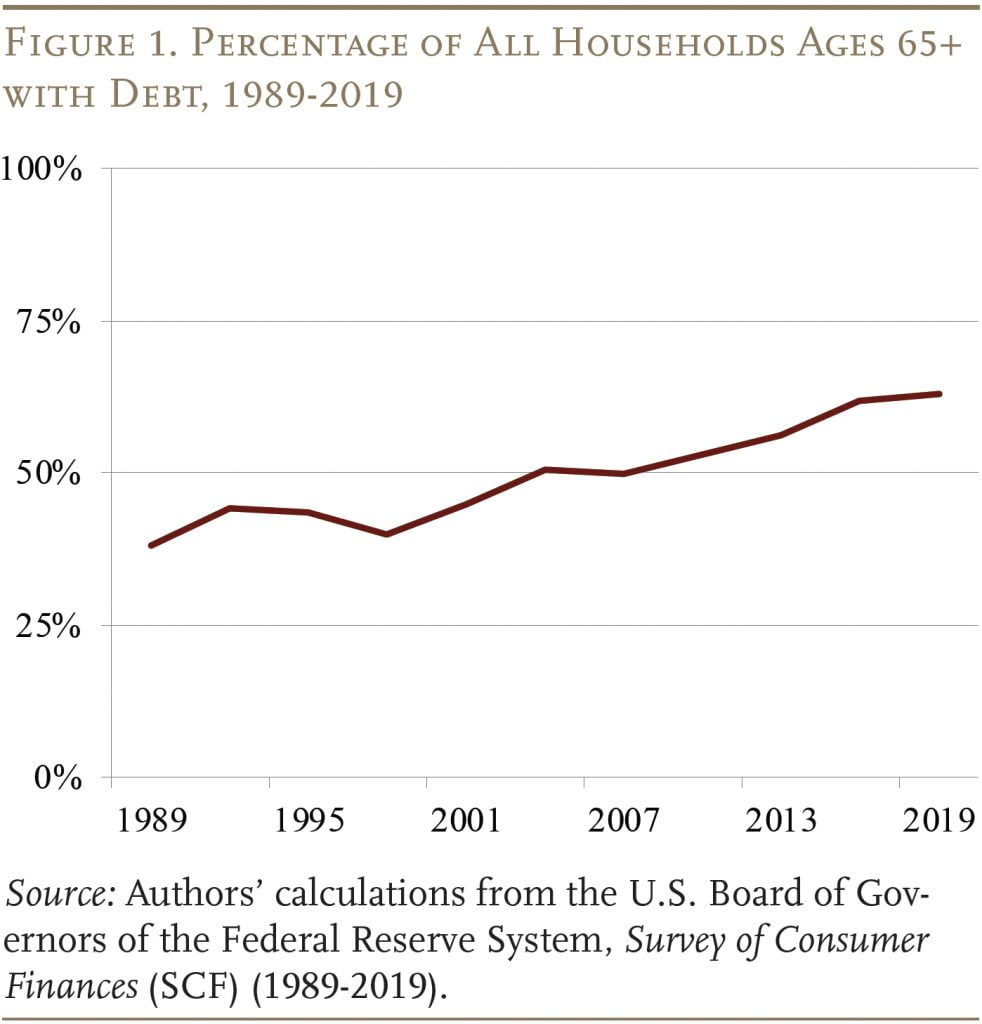
Since the 1990s, the share of Americans ages 65+ with debt has been increasing, raising concerns among policymakers and researchers (see Figure 1).2Brown, Dynan, and Figinski (2019); Butrica and Karamcheva (2013, 2018); and Lusardi, Mitchell, and Oggero (2018, 2020). Much of this growth, though, is driven by rising mortgage debt.3Moulton, Haurin, and Loibl (2019) and Brown, Dynan, and Figinski (2019). Given the low interest rate environment in recent decades, carrying mortgage debt into retirement may actually be financially savvy. Indeed, prior studies have suggested that older households are refinancing their mortgage without extracting any additional equity.4Spader (2021). But carrying housing debt into retirement may not be a good move for everyone as mortgage payments can become a substantial portion of retirement expenses.5Low-wealth borrowers experienced disproportionate rises in household mortgage debt-to-equity ratios in recent years. See Lusardi, Mitchell, and Oggero (2020); Brown, Dynan, and Figinski (2019); and Collins, Hembre, and Urban (2020). Collins, Hembre, and Urban (2020) also find that mortgage defaults among older households have stayed steady despite increasing leverage.
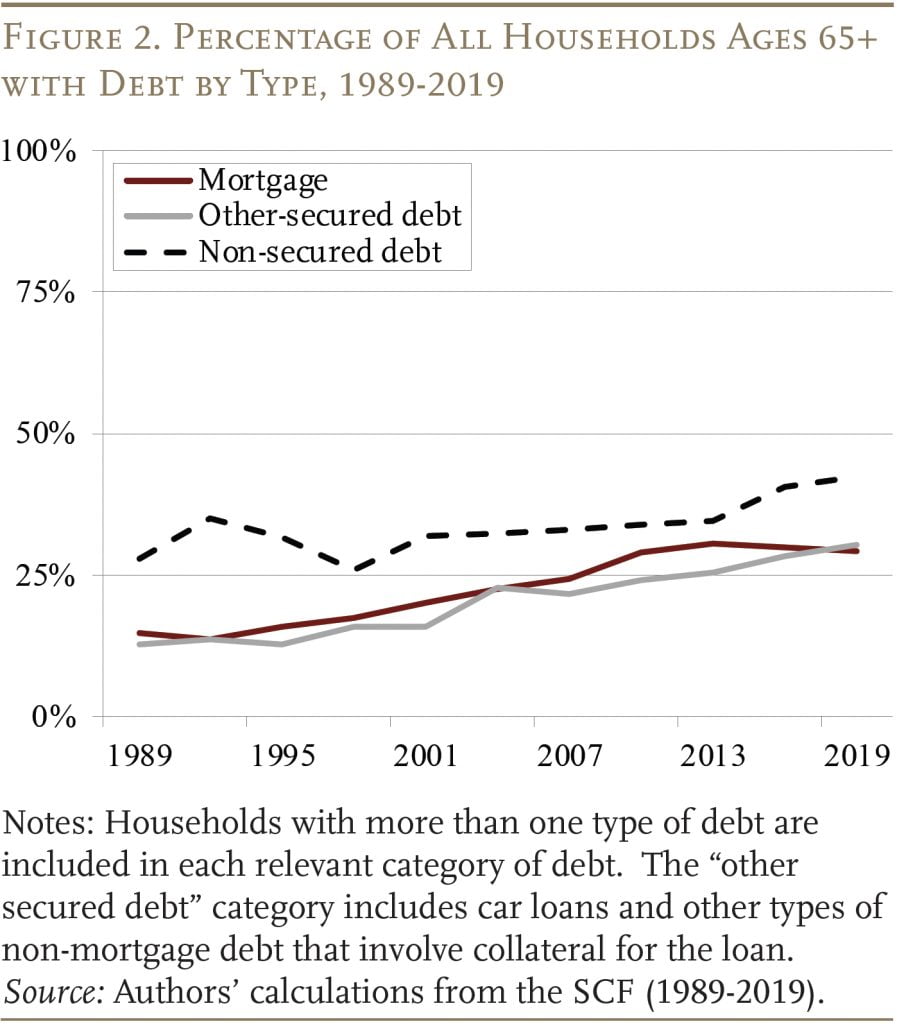
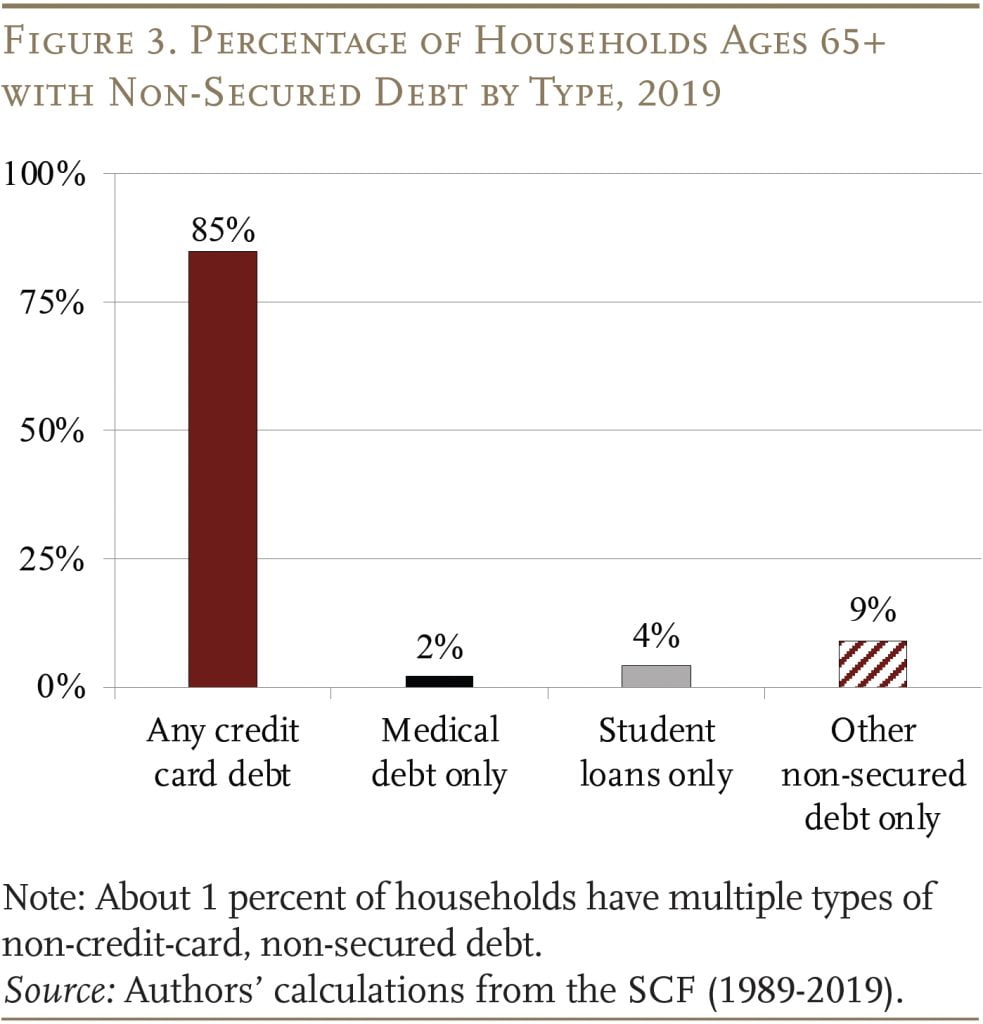
While much of the growth in borrowing among older households is due to rising mortgage debt, other non-secured forms of debt – such as credit card, student loan, and medical – have also increased (see Figure 2).6See Butrica and Karamcheva (2018) on credit card debt, Federal Reserve Bank of New York (2022) on student loan debt, and Lusardi, Mitchell, and Oggero (2020) on medical debt. This type of debt can put older households at risk of financial distress. Credit card debt – the dominant form of non-secured debt held by households (see Figure 3) – has high-interest rates, which can lead to the rapid accumulation of large balances and may result in serious financial consequences, such as bankruptcy.7Domowitz and Sartain (1999) and Gross and Souleles (2002). It is also worth noting that older households have a very limited understanding of interest compounding (Lusardi and Tufano 2015). For recent data on trends in credit card debt levels and delinquency rates, see Haughwout et al. (2023). The smaller forms of non-secured debt can also raise concerns, particularly for otherwise financially vulnerable groups.8Student loan debt among older households cannot be discharged in bankruptcy and defaulting can lead to reduced Social Security benefits (U.S. Government Accountability Office 2014). Moreover, student loan debt has grown more rapidly among older households with lower wealth, resulting in greater financial fragility; see Wettstein and Liu (2023) and Brown, Dynan, and Figinski (2019). Rising medical debt may lead to greater inequality in retirement security as well, since it is also more prevalent among lower-income households (Kluender et al., 2021). Finally, nonsecured debt is not only detrimental to the financial security of older households but can also negatively impact their health (Mudrazija and Butrica 2021).
In short, it is not clear how much of the growth in older households with debt is a concern. The goal of this study is to distinguish between borrowers who are at high risk of jeopardizing their retirement and the financially savvy borrowers that made the most of low interest rates.
Defining Low- and High-Risk Borrowers
The analysis draws from two nationally representative surveys – the Survey of Consumer Finances (SCF) and the Health and Retirement Study (HRS). The SCF, administered triennially since 1983, captures rich information on household balance sheets, including the various types of debt.9Since the data were not consistent in survey years prior to 1989, the analysis will begin in that year. To supplement the SCF, the analysis uses the HRS, a biennial survey of households ages 51+ with detailed data on household assets and debts, to provide more information by race.10A major drawback of the HRS is that the amount of credit card debt is not available until 2008. However, we can observe household’s “other debt,” which includes credit card balances, medical debts, life insurance policy loans, and loans from relatives. The majority of this debt category can be considered “high risk.”
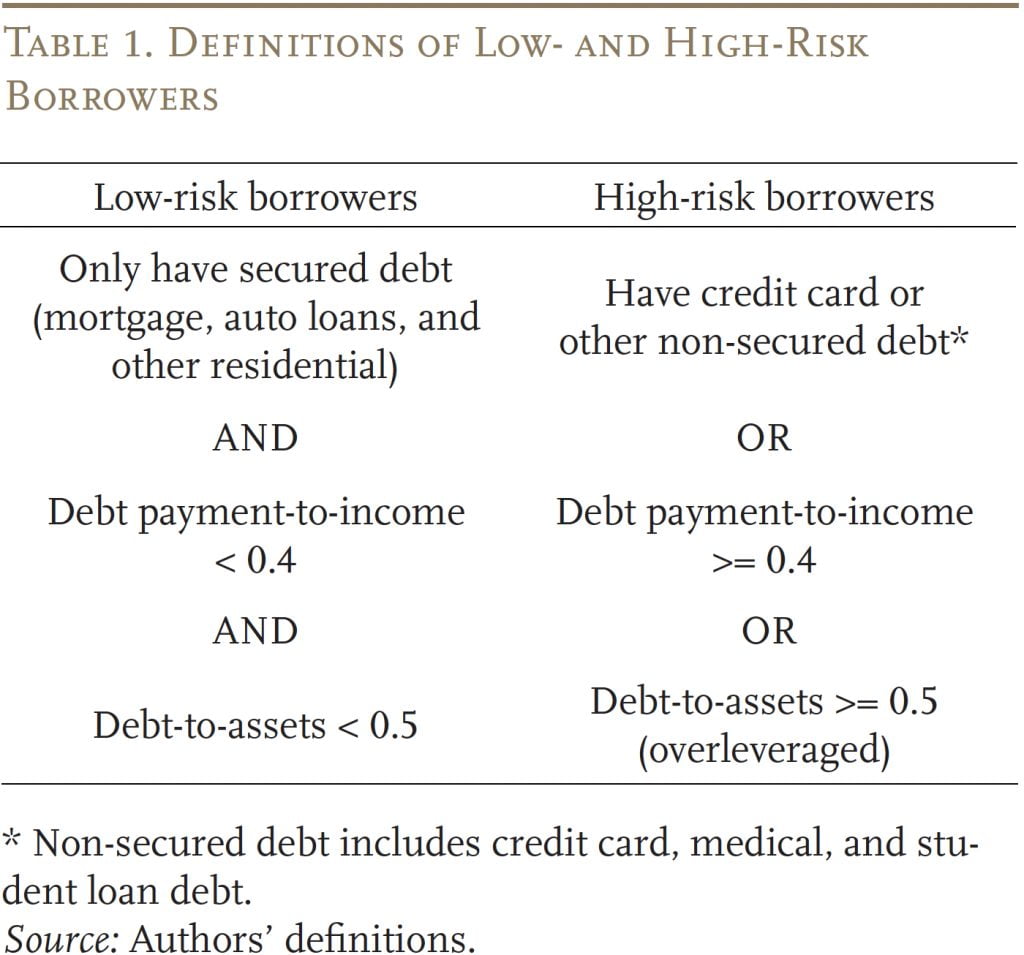
The first step is to group older households with debt into those at “low-risk” and “high-risk” of financial distress in retirement as a result of the debt (see Table 1). The factors used to group households (type of debt, debt payment-to-income ratio, and debt-to-assets ratio) are commonly used by lenders or other studies.11Lusardi, Mitchell, and Oggero (2020), Brown, Dynan, and Figinski (2019), and Butrica and Karamcheva (2018) examine mortgage debt and non-mortgage debt separately. Lenders often require debt payments-to-income to be below 36-45 percent, so we took the midpoint. Lusardi, Mitchell, and Oggero (2020) also group older households with debt-to-asset ratios higher than 50 percent as concerning. It is important to include households with any revolving credit card debt in the “high-risk” group, since many of these borrowers could experience bad outcomes, even though they would not be captured by the other debt measures (in Table 1).12Specifically, since minimum payments on credit cards are typically very small, borrowers would rarely exceed the debt payment-to-income threshold. And a borrower would have to have extremely high levels of credit card debt to exceed the debt-to-asset threshold. Even so, many credit card borrowers do carry a substantial level of debt. Among older households with revolving credit card balances, the median household’s credit card debt equals 70 percent of their monthly income. Even at the 25th and 10th percentiles, revolving credit card balances equal 20 percent and 6 percent of income, respectively.
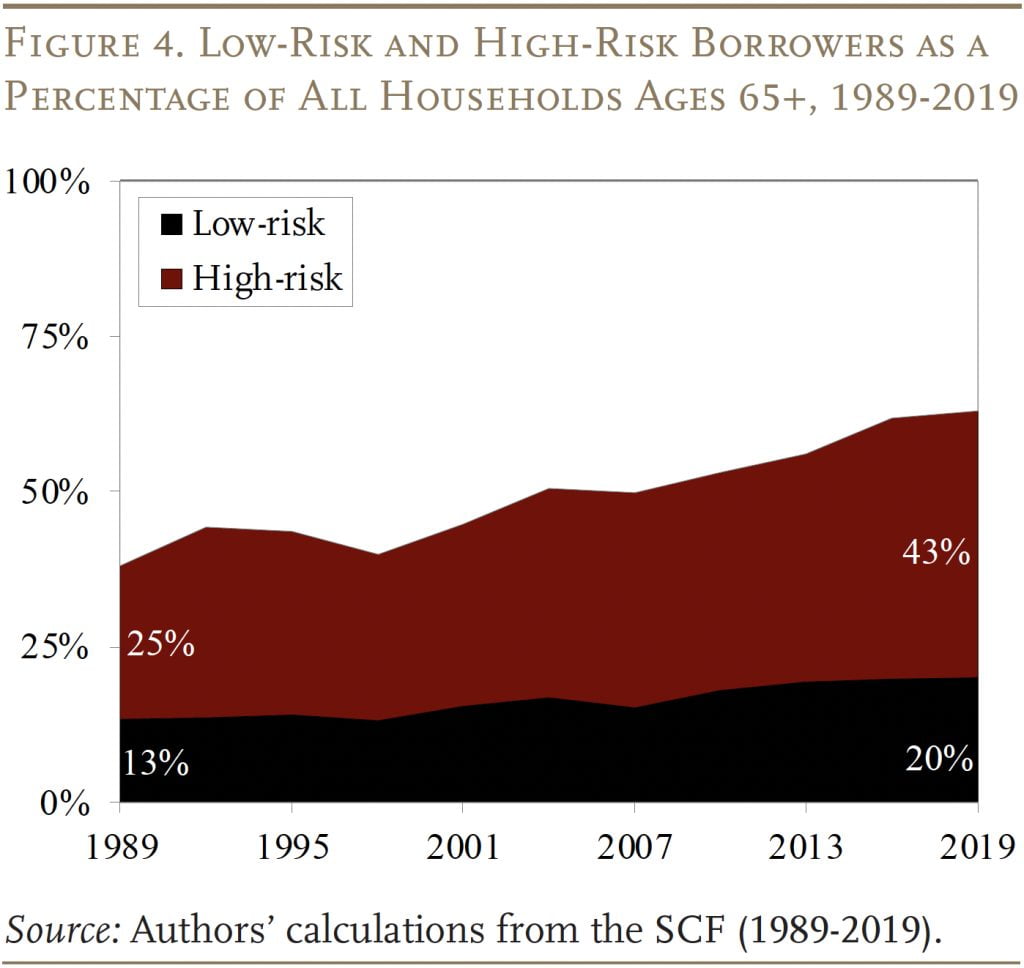
Breaking down households by risk level reveals that, while both groups have grown over time, overall growth is driven by the high-risk households (see Figure 4). While these high-risk borrowers are clearly the main concern, it is first worth confirming whether or not the growth in low-risk borrowers is troubling as well. Fortunately, our analysis finds that a large share of the growth for this group – about one-half – is due to financially savvy borrowers who took advantage of low interest rates to obtain or refinance a mortgage loan.13Low interest rates enticed some households to make investments in housing, which may not necessarily harm their retirement security. These financially savvy borrowers may have been taking advantage of the rapidly declining borrowing costs and may not have carried debt in retirement had interest rates stayed at early 1990s’ levels. To identify the impact of low interest rates on growth in low-risk households, the analysis separates out households who obtained or refinanced a mortgage in the prior three years and have no other forms of debt as “financially savvy.” See Chen, Liu, and Munnell (2023) for a full description of this analysis. In contrast, virtually none of the growth for high-risk households is explained by such benign factors. So, the next step is to take a closer look at the characteristics of these borrowers.
Who Are the High-Risk Borrowers?
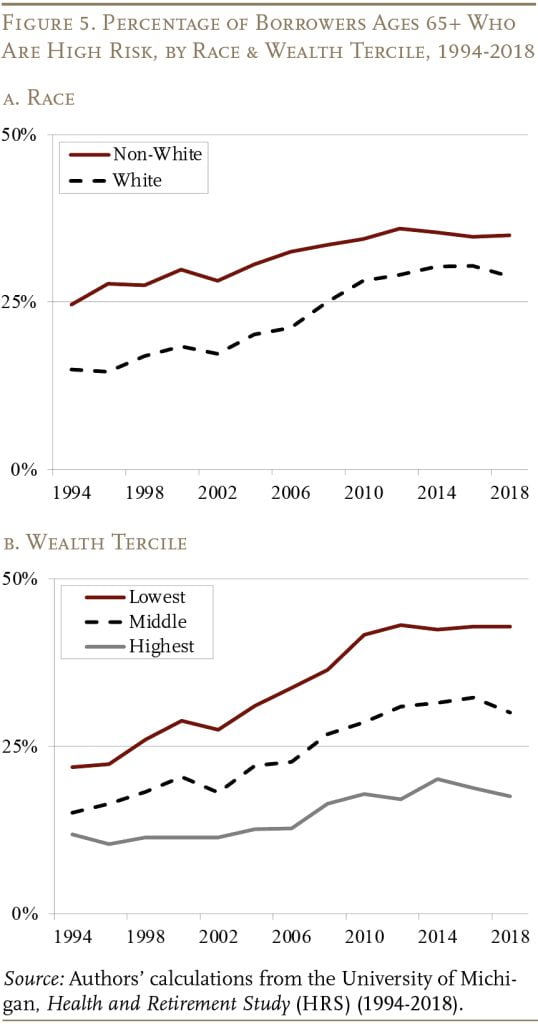
The first step is to simply look at high-risk borrowers’ race/ethnicity and wealth: two characteristics that tend to be associated with the likelihood of being financially vulnerable. The patterns here are as expected – non-White households are more likely to fall into the high-risk borrower group, though the gap with White households has been narrowing over time (see Figure 5a). Similarly, households with less wealth are also more likely to be high-risk borrowers; here, though, the gap with high-wealth households has been widening (see Figure 5b).
The next step is to conduct a more detailed analysis to identify whether specific subgroups of high-risk borrowers exist who may have different reasons and needs for accumulating debt. This approach uses a Latent Class model, which groups households based on wealth, medical and financial shocks, homeownership, debt characteristics, and difficulty in handling essential expenses.14A household is defined as not able to afford financial expenses if any of the following is true: living below 200 percent of the poverty line; receiving benefits from the Supplemental Nutrition Assistance Program, Temporary Assistance for Needy Families, Supplemental Security Income, or Medicaid; or struggling to pay for food or mortgage. Additionally, we examine whether the household experienced shocks that may lead to a sudden increase in expenditures or drop in asset values. We consider three types of shocks: 1) a housing shock, where the value of the home fell significantly; 2) a medical shock, where the household experienced a spike in out-of-pocket health spending; and 3) a marital shock, where the household head was recently divorced.
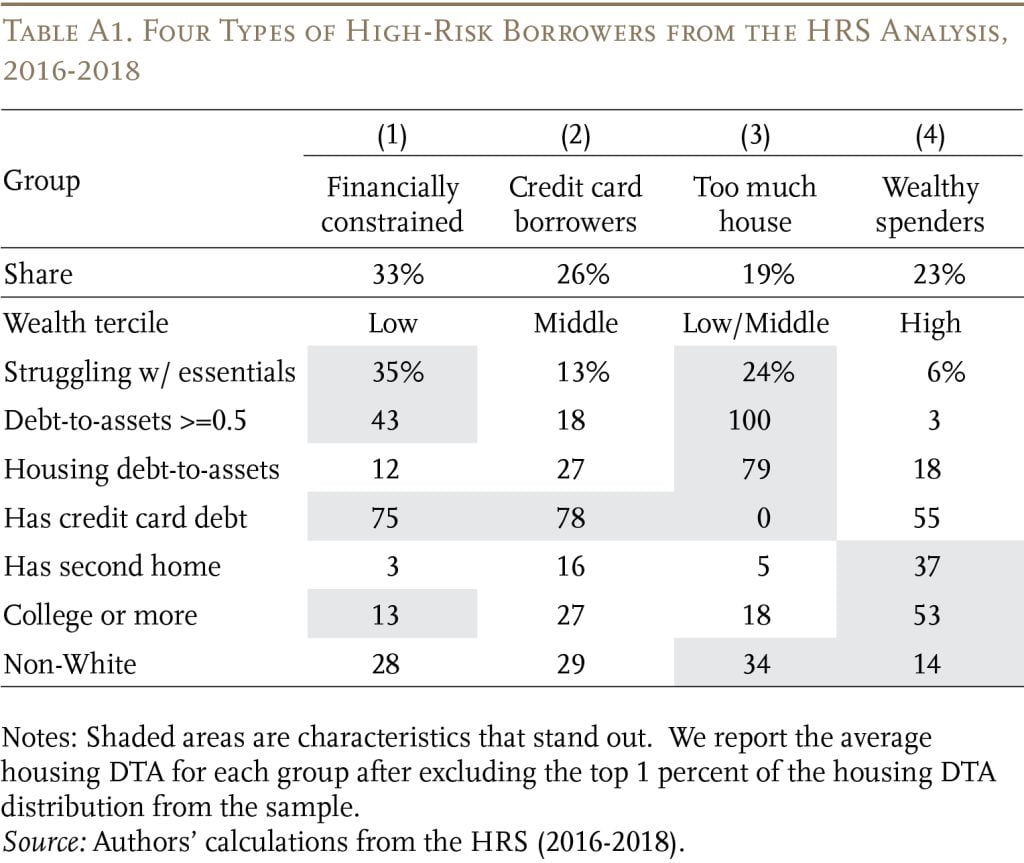
Four clear subgroups emerge from the analysis (see Table 2).15A six-class model in the SCF and a four-class model in the HRS provide the best balance between fit statistics and interpretability. While the SCF produced two additional classes, they represented a further breakdown of two of the subgroups in the HRS. We combine two “financially constrained” groups that largely vary by marital status and two groups with “too much mortgage” that vary by levels of wealth. Our main results are based on the SCF. The HRS shows similar results and can be found in the Appendix. The largest group is “financially constrained” households, which have low levels of wealth, are often overleveraged, and are more likely to struggle with the essentials. The vast majority of this group has credit card debt and one out of ten has medical debt. They are also disproportionately non-White and least likely to have a college degree. This group may be borrowing just to get by.
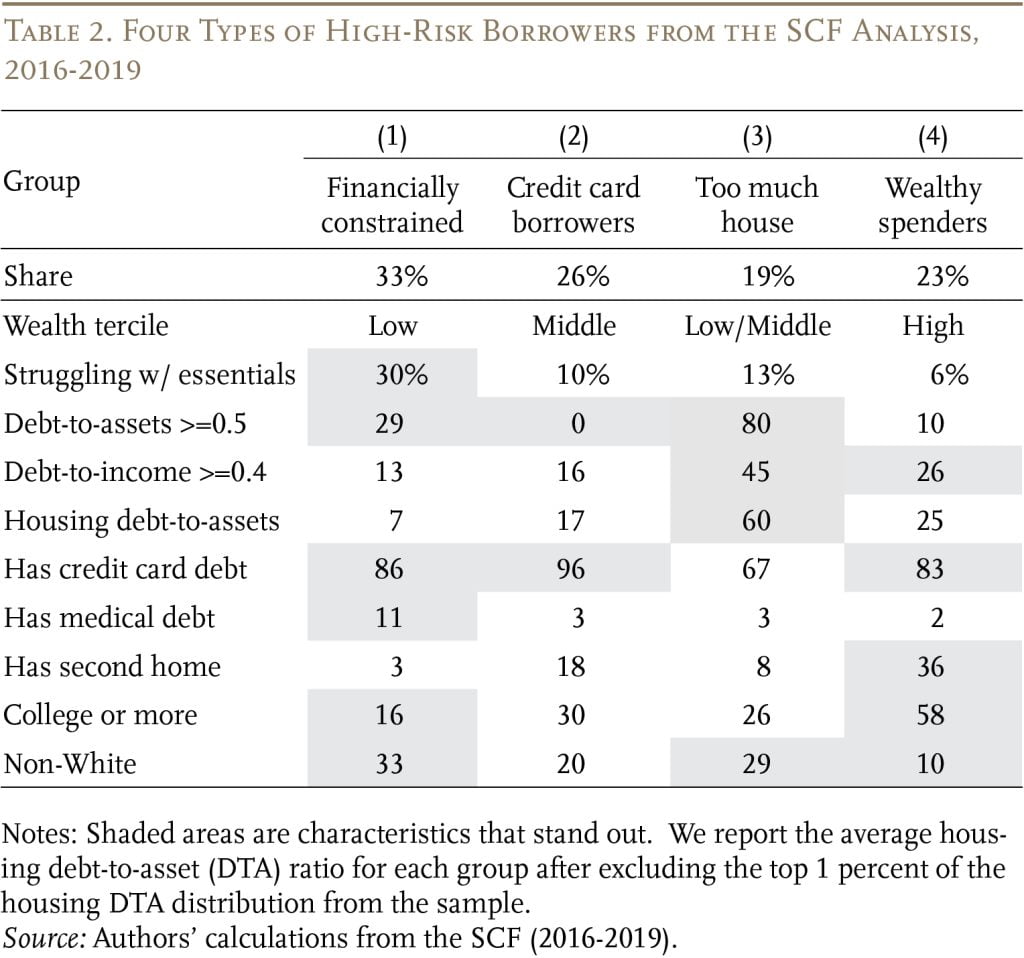
The second subgroup is the “credit card borrowers,” which includes middle-wealth households with no obvious need to borrow. Compared to the financially constrained group, these households are in much better shape, as few struggle to meet basic needs and none of them carry excessive debt compared to their assets.
The third subgroup cannot afford their house. They are low/middle-wealth households whose house has become a large liability and constraint on their income in retirement. Specifically, their housing debt equals 60 percent of their home value (many have experienced large drops in their housing value since purchase) and they need to dedicate over 40 percent of their income to debt payments. This group is also disproportionately non-White.
Lastly, about one-fifth of the high-risk borrowers are “wealthy spenders.” Despite being in the top third of the wealth distribution, about a quarter of their income goes to debt payments, about 80 percent have credit card debt, and over a third have second homes.
How Can We Help High-Risk Borrowers?
What can be done to reduce the financial vulnerability of high-risk borrowers? Clearly, given their diverse characteristics, no one-size-fits-all solution exists. Thus, the best approach would be for financial counselors, consumer advocates, and/or policymakers to develop tailored solutions for the specific needs of the four groups and to target assistance to those most vulnerable to financial hardship. While a detailed strategy is beyond the scope of this study, a few thoughts may help.
The first and largest group of high-risk borrowers is characterized by their “financial constraints.” For these households, debt counseling and consolidation may help, but many struggle to meet basic needs, so they need more resources. One approach is strengthening means-tested programs, like Supplemental Security Income (SSI). Since SSI currently has extremely low earnings and asset thresholds, many low-income seniors are not eligible, and the SSI benefit amount is less than the poverty level. Improving a program like SSI could provide a lifeline to reduce their burden. Another approach is to enhance Social Security’s Special Minimum Benefit, which is meant to provide an adequate level of benefits for lifetime low-earners. However, the value of this benefit has eroded, and the number receiving the minimum benefit declined from around 200,000 in the 1990s to about 25,000 in 2022.16Fewer new beneficiaries are receiving the price-indexed special minimum benefit because wage growth typically exceeds price growth; thus, their wage-indexed regular benefit is usually higher.
The second group – “credit card borrowers” – look very different from the “financially constrained” households and have no obvious need to accumulate debt, particularly costly credit card debt. Households in this group may not understand the implications of revolving credit card debt, how the high interest rates affect unpaid balances, and what the minimum payment means.17Prior research has shown that about 30 percent of credit card owners pay roughly the minimum amount each month. Interestingly, many continue to pay around the minimum even as their minimum required payment increases, suggesting that anchoring – rather than liquidity constraints – may be driving repayment behavior (Keys and Wang 2019). Some in this group, who do not have an emergency fund, may be using their credit card to help smooth expense shocks. These households could benefit from traditional financial counseling programs to curtail the use of high-interest-rate debt and to encourage precautionary saving for unexpected expenses. Legislation requiring credit card issuers to provide better information to consumers could also help.18The CARD Act of 2009 tried to address this problem by requiring credit card statements to include a table that outlines the monthly amount required to pay off the current credit card balance in three years. However, this information is not required for online or mobile payments, and roughly 80 percent of accountholders use the online portal and over 60 percent use mobile apps. The information presented in the web and mobile payment methods can vary by card issuer. Some will present the minimum payment first, while others will present the statement of current balance first. For example, when consumers navigate to a credit card payment screen, the first option listed could be the amount to pay off the full balance. Another option is for a caution to appear if consumers opt to pay an amount that is less than the balance they owe.
The third group has “too much house” and would best be served by programs that help these overstretched homeowners reduce their housing burden. Options could include refinancing their mortgage to reduce their monthly payments or downsizing; albeit this step could be challenging if their housing equity has declined, for some below their purchase price. Policymakers and financial counselors could also encourage near-retirees to prioritize paying off their mortgage before retirement to avoid having mortgage payments overwhelm expenses in retirement.
Finally, the fourth group of “wealthy spenders” needs to get a handle on their discretionary spending to help rein in their borrowing. Many in this group have a second home, so selling it is one way to manage their debt burden. While these households may be a lower priority for policymakers as they are the least vulnerable, general financial counseling could also help them change their habits so that they do not consume beyond their means.
Conclusion
A rapidly growing share of U.S. households carry debt in retirement, raising concerns about their financial security; and the vast majority of this growth is driven by borrowers who are at “high risk” of financial trouble. But the characteristics of these high-risk borrowers vary a lot. Some groups seem to have the resources to manage their debt, so financial counseling on the risks of excessive credit card or mortgage debt or improved disclosure requirements for lenders may help them get a handle on their borrowing. Other groups have very few resources to work with and struggle with essential expenses. For these borrowers, financial education can provide only limited help, and they need more resources, perhaps through broader access to means-tested programs like SSI. The key takeaway is the recognition that no one-size-fits-all solution exists, so understanding the diverse characteristics of high-risk borrowers is essential to developing effective policies to help older households struggling with debt.
References
Brown, Jason, Karen Dynan, and Theodore Figinski. 2019. “The Risk of Financial Hardship in Retirement: A Cohort Analysis.” WP2019-10. Philadelphia, PA: Pension Research Council.
Butrica, Barbara A. and Nadia S. Karamcheva. 2013. “Does Household Debt Influence the Labor Supply and Benefit Claiming Decisions of Older Americans?” Working Paper 2013-22. Chestnut Hill, MA: Center for Retirement Research at Boston College
Butrica, Barbara A. and Nadia S. Karamcheva. 2018. “In Debt and Approaching Retirement: Claim Social Security or Work Longer?” AEA Papers and Proceedings 108: 401-06.
Chen, Anqi, Siyan Liu, and Alicia H. Munnell. 2023. “What Are the Implications of Rising Debt for Older Americans?” Working Paper 2023-11. Chestnut Hill, MA: Center for Retirement Research at Boston College.
Collins, J. Michael, Erik Hembre, and Carly Urban. 2020. “Exploring the Rise of Mortgage Borrowing Among Older Americans.” Regional Science and Urban Economics 83(103524).
Domowitz, Ian and Robert L. Sartain. 1999. “Determinants of the Consumer Bankruptcy Decision.” The Journal of Finance 54(1): 403-420.
Federal Reserve Bank of New York. 2022. “Quarterly Report on Household Debt and Credit: 2021: Q4.” New York, NY.
Gross, David B. and Nicholas S. Souleles. 2002. “An Empirical Analysis of Personal Bankruptcy and Delinquency.” The Review of Financial Studies 15(1): 319-347.
Haughwout, Andrew, Donghoon Lee, Daniel Mangrum, Joelle Scally, and Wilbert van der Klaauw. 2023. “Credit Card Markets Head Back to Normal After Pandemic Pause.” Liberty Street Economics Blog Post. New York, NY: Federal Reserve Bank of New York.
Keys, Benjamin J. and Jialan Wang. 2019. “Minimum Payments and Debt Paydown in Consumer Credit Cards.” Journal of Financial Economics 131(3): 528-548.
Kluender, Raymond, Neale Mahoney, Francis Wong, and Wesley Yin. 2021. “Medical Debt in the US, 2009-2020.” Journal of the American Medical Association 326(3): 250-256.
Lusardi, Annamaria and Peter Tufano. 2015. “Debt Literacy, Financial Experiences, and Overindebtedness.” Journal of Pension Economics & Finance 14(4): 332-368.
Lusardi, Annamaria, Olivia S. Mitchell, and Noemi Oggero. 2018. “The Changing Face of Debt and Financial Fragility at Older Ages.” AEA Papers and Proceedings 108: 407-11.
Lusardi, Annamaria, Olivia S. Mitchell, and Noemi Oggero. 2020. “Debt and Financial Vulnerability on the Verge of Retirement.” Journal of Money, Credit and Banking 52(5): 1005-1034.
Moulton, Stephanie, Donald Haurin, and Caezilia Loibl. 2019. “Debt Stress and Mortgage Borrowing in Older Age: Implications for Economic Security in Retirement.” Economic Inquiry 54(1): 201-214.
Mudrazija, Stipica and Barbara A. Butrica, 2021. “How Does Debt Shape Health Outcomes for Older Americans?” Working Paper 2021-17. Chestnut Hill, MA: Center for Retirement Research at Boston College.
Spader, Jonathan. 2021. “Can Changing Demographics or Refinancing Behaviors Explain the Rising Levels of Housing Debt Among Older Americans?” Housing Policy Debate 31(2): 290-305.
University of Michigan. Health and Retirement Study, 1994-2018. Ann Arbor, MI.
U.S. Board of Governors of the Federal Reserve System. Survey of Consumer Finances, 1989-2019. Washington, DC.
U.S. Government Accountability Office. 2014. “Older Americans’ Inability to Repay Student Loans May Affect Financial Security of a Small Percentage of Retirees.” Washington, DC.
Wettstein, Gal and Siyan Liu. 2023. “How Do Unpaid Student Loans Impact Social Security Benefits?” Issue in Brief 23-1. Chestnut Hill, MA: Center for Retirement Research at Boston College.
Appendix
Endnotes
- 1Chen, Liu, and Munnell (2023).
- 2Brown, Dynan, and Figinski (2019); Butrica and Karamcheva (2013, 2018); and Lusardi, Mitchell, and Oggero (2018, 2020).
- 3Moulton, Haurin, and Loibl (2019) and Brown, Dynan, and Figinski (2019).
- 4Spader (2021).
- 5Low-wealth borrowers experienced disproportionate rises in household mortgage debt-to-equity ratios in recent years. See Lusardi, Mitchell, and Oggero (2020); Brown, Dynan, and Figinski (2019); and Collins, Hembre, and Urban (2020). Collins, Hembre, and Urban (2020) also find that mortgage defaults among older households have stayed steady despite increasing leverage.
- 6See Butrica and Karamcheva (2018) on credit card debt, Federal Reserve Bank of New York (2022) on student loan debt, and Lusardi, Mitchell, and Oggero (2020) on medical debt.
- 7Domowitz and Sartain (1999) and Gross and Souleles (2002). It is also worth noting that older households have a very limited understanding of interest compounding (Lusardi and Tufano 2015). For recent data on trends in credit card debt levels and delinquency rates, see Haughwout et al. (2023).
- 8Student loan debt among older households cannot be discharged in bankruptcy and defaulting can lead to reduced Social Security benefits (U.S. Government Accountability Office 2014). Moreover, student loan debt has grown more rapidly among older households with lower wealth, resulting in greater financial fragility; see Wettstein and Liu (2023) and Brown, Dynan, and Figinski (2019). Rising medical debt may lead to greater inequality in retirement security as well, since it is also more prevalent among lower-income households (Kluender et al., 2021). Finally, nonsecured debt is not only detrimental to the financial security of older households but can also negatively impact their health (Mudrazija and Butrica 2021).
- 9Since the data were not consistent in survey years prior to 1989, the analysis will begin in that year.
- 10A major drawback of the HRS is that the amount of credit card debt is not available until 2008. However, we can observe household’s “other debt,” which includes credit card balances, medical debts, life insurance policy loans, and loans from relatives. The majority of this debt category can be considered “high risk.”
- 11Lusardi, Mitchell, and Oggero (2020), Brown, Dynan, and Figinski (2019), and Butrica and Karamcheva (2018) examine mortgage debt and non-mortgage debt separately. Lenders often require debt payments-to-income to be below 36-45 percent, so we took the midpoint. Lusardi, Mitchell, and Oggero (2020) also group older households with debt-to-asset ratios higher than 50 percent as concerning.
- 12Specifically, since minimum payments on credit cards are typically very small, borrowers would rarely exceed the debt payment-to-income threshold. And a borrower would have to have extremely high levels of credit card debt to exceed the debt-to-asset threshold. Even so, many credit card borrowers do carry a substantial level of debt. Among older households with revolving credit card balances, the median household’s credit card debt equals 70 percent of their monthly income. Even at the 25th and 10th percentiles, revolving credit card balances equal 20 percent and 6 percent of income, respectively.
- 13Low interest rates enticed some households to make investments in housing, which may not necessarily harm their retirement security. These financially savvy borrowers may have been taking advantage of the rapidly declining borrowing costs and may not have carried debt in retirement had interest rates stayed at early 1990s’ levels. To identify the impact of low interest rates on growth in low-risk households, the analysis separates out households who obtained or refinanced a mortgage in the prior three years and have no other forms of debt as “financially savvy.” See Chen, Liu, and Munnell (2023) for a full description of this analysis.
- 14A household is defined as not able to afford financial expenses if any of the following is true: living below 200 percent of the poverty line; receiving benefits from the Supplemental Nutrition Assistance Program, Temporary Assistance for Needy Families, Supplemental Security Income, or Medicaid; or struggling to pay for food or mortgage. Additionally, we examine whether the household experienced shocks that may lead to a sudden increase in expenditures or drop in asset values. We consider three types of shocks: 1) a housing shock, where the value of the home fell significantly; 2) a medical shock, where the household experienced a spike in out-of-pocket health spending; and 3) a marital shock, where the household head was recently divorced.
- 15A six-class model in the SCF and a four-class model in the HRS provide the best balance between fit statistics and interpretability. While the SCF produced two additional classes, they represented a further breakdown of two of the subgroups in the HRS. We combine two “financially constrained” groups that largely vary by marital status and two groups with “too much mortgage” that vary by levels of wealth. Our main results are based on the SCF. The HRS shows similar results and can be found in the Appendix.
- 16Fewer new beneficiaries are receiving the price-indexed special minimum benefit because wage growth typically exceeds price growth; thus, their wage-indexed regular benefit is usually higher.
- 17Prior research has shown that about 30 percent of credit card owners pay roughly the minimum amount each month. Interestingly, many continue to pay around the minimum even as their minimum required payment increases, suggesting that anchoring – rather than liquidity constraints – may be driving repayment behavior (Keys and Wang 2019).
- 18The CARD Act of 2009 tried to address this problem by requiring credit card statements to include a table that outlines the monthly amount required to pay off the current credit card balance in three years. However, this information is not required for online or mobile payments, and roughly 80 percent of accountholders use the online portal and over 60 percent use mobile apps. The information presented in the web and mobile payment methods can vary by card issuer. Some will present the minimum payment first, while others will present the statement of current balance first.


Chen, Anqi, Siyan Liu, and Alicia H. Munnell. 2023. "What Are the Implications of Rising Debt for Older Americans?" Issue in Brief 23-20. Chestnut Hill, MA: Center for Retirement Research at Boston College.