
What Should 401(k)/IRA Balances Be?

Alicia H. Munnell is a columnist for MarketWatch and senior advisor of the Center for Retirement Research at Boston College.
2013 Survey of Consumer Finances shows drop in balances and in participation.
Last week’s blog post reported that – according to the Federal Reserve’s 2013 Survey of Consumer Finances – 401(k)/IRA balances for the typical working household approaching retirement declined from $120,000 in 2010 to $111,000 in 2013. This drop is startling given the positive developments between 2010 and 2013 – a recovering economy, strong stock market performance, and the continuing maturation of the 401(k) system.
An even more interesting issue than the decline in reported balances is how much should we expect to see in these 401(k)/IRA accounts. In an attempt to answer that question, we did a simple spreadsheet analysis for a representative individual. This individual was age 29 in 1982 – the first year 401(k)s were available – and reached 60 in 2013. He earned Social Security’s average wage throughout his life and contributed 6 percent of salary and received a 50-percent match from his employer. He had a 50:50 stock/bond allocation, and received actual investment returns over the period. Interestingly, these returns were higher than long-run averages. Based on these assumptions, this individual would have accumulated $373,000 (see Figure). In fact, according to the 2013 SCF, the balance for the typical individual approaching retirement, as opposed to the household mentioned above, was $100,000. What happened?
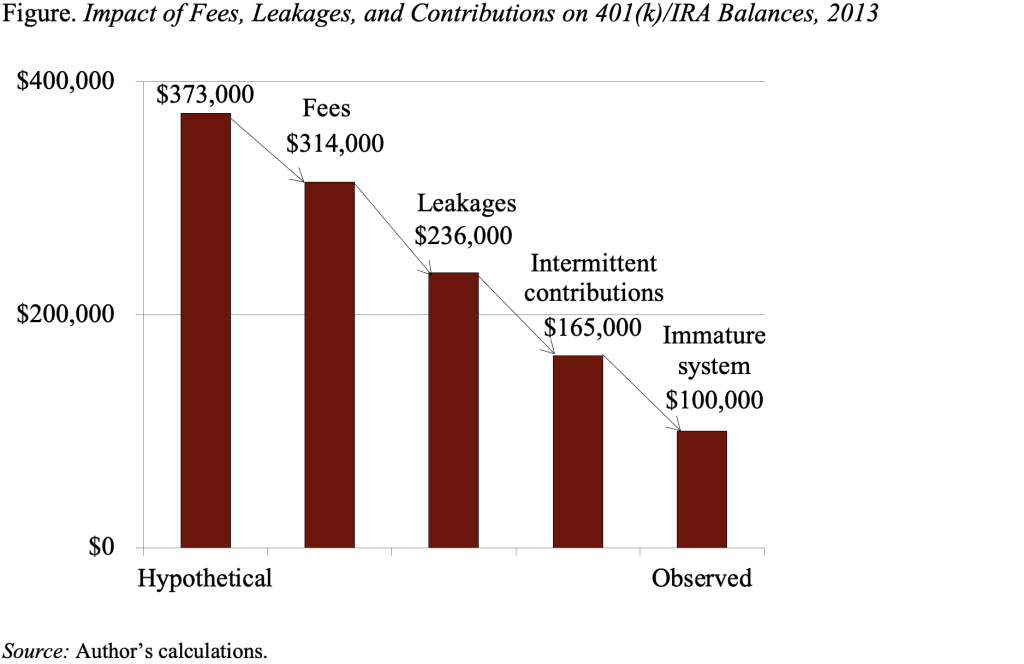
Lots of things happened. First, the calculation of $373,000 ignores investment expenses; using expense data for equity and bonds from the Investment Company Institute (2014) reduces the expected balance to $314,000. Second, the original calculation ignores leakages. Recent work we have done suggests that 1.5 percent of assets leak out of the 401(k)/IRA system each year. Applying that percentage reduces the pile still further to $236,000.
The remaining gap between the $236,000 and the observed individual 401(k)/IRA balances of $100,000 is due to a failure to contribute. We apply a 30-percent non-participation rate – roughly the average reported by Vanguard since the turn of the century – to estimate the portion of the gap attributable to intermittent contribution patterns. This step reduces assets to $165,000. The rest is attributed to low contribution rates in early years as the program was beginning to spread. In other words, individual holdings in retirement accounts for those approaching retirement might be $165,000 if the system were fully mature.
Before you dismiss the result for the representative individuals as being too simplistic, my colleague Tony Webb did a much more realistic exercise using data from the Survey of Income and Program Participation (SIPP) for the period 1982 through 2006. The percentage reductions for each factor turned out to be very close to the assumed values, leaving people at virtually the actual balances observed in the 2002-06 SIPP.
The alarming result is that only slightly more than one quarter of contributions plus investment earnings end up in accounts by retirement. Clearly, this system could function more efficiently.