
Which Long-Term Care Support Policies Are Best for Caregivers?
The brief’s key findings are:
- Family caregivers are vital to meeting the long-term care needs of older adults, but it means financial sacrifices in lost earnings or out-of-pocket costs.
- Various policies could reduce the burden, but it remains unclear which ones help the most, so this study asked caregivers directly.
- Caregiver focus groups strongly prefer direct payments for caregiving and cost reimbursement over respite care, tax or Social Security credits, and paid leave.
- Direct payments are especially popular among non-White caregivers, which accords with national data showing they provide more care and work less.
- Finally, a separate analysis estimating the monetary value of the policy options aligns with the views of focus group participants.
Introduction
Family caregiving is the cornerstone of long-term care for older adults, especially in underserved communities. This care, however, poses significant challenges and often requires financial sacrifices from caregivers. In response, researchers, practitioners, and policymakers have proposed various options to alleviate the financial strain, but it remains unclear which options would most benefit the caregivers. Also unclear is how the effects might vary by caregiver characteristics, such as race/ethnicity, income, and work status.
To understand the perceived and actual impact of the options, this brief, which is based on a recent study, uses a mixed-methods approach.1 The qualitative portion is based on focus group interviews with a diverse contingent of caregivers to understand which policies they believe would improve their retirement security the most. These discussions are supplemented with data analysis from national surveys to examine which types of caregivers could benefit more from certain policies and how monetary outcomes align with the focus group responses.
The discussion proceeds as follows. The first section describes the financial burden on caregivers and various policies that might help. The second section presents the focus group results, which show that participants of all types prefer direct payments for family caregiving or reimbursement for caregiving expenses over tax credits, Social Security credits, or family leave. The third section summarizes the quantitative analysis, which helps explain why caregivers – especially non-White individuals – favor direct payments. It also shows that back-of-the-envelope estimates of the monetary value of various policy options align with the value perceived by focus group participants. The final section concludes that while much of the policy discussion has focused on paid family leave, this option is the least popular among those providing care to older adults, who tend to prefer direct payments for caregiving and reimbursements for care-related spending.
Background
In 2021, about 38 million family caregivers in the United States provided an estimated 36 billion hours of care to an adult with limitations in daily activities.2 While family caregiving is the backbone of such care, particularly for underserved communities, caregivers often face a significant financial burden, from both the direct costs of providing care and the reduced earnings from working less.
Family caregivers are more likely than non-caregivers to reduce their work hours, switch to jobs that are less demanding with lower pay, stop working altogether, or retire early due to caregiving responsibilities.3 Not surprisingly, caregivers who provide more care face a larger negative impact on their work and earnings, but even short-term caregiving can have labor market consequences.4
In response, policymakers have proposed ways to ease their financial burden, but existing policies are often limited and piecemeal, and vary dramatically by state. As a result, the implementation of many of these policies is limited.
Family caregivers could claim the federal Child and Dependent Care Tax Credit to cover some out-of-pocket costs, up to $3,000 for one dependent and $6,000 for two or more. However, the credit is non-refundable, and the caregiver must itemize their deductions. The credit also only applies to costs incurred so the caregiver can work or look for work, so it excludes costs such as home modifications or additions, and caregivers who are retired are not eligible at all. As a result, few caregivers of older adults claim it.5
Policies to help reduce the labor market costs of caregiving are also limited. Some employers may offer limited paid leave or generous vacation or sick time that can be used for caregiving. But typically, workers with access to these benefits are higher earners who work for large employers. Workers without such generous employer benefits may be eligible for the federal Family and Medical Leave Act (FMLA), which provides up to 12 weeks of unpaid job-protected leave. While this job protection is valuable, many low- and moderate-income workers would face substantial financial hardship from 12 weeks of unpaid leave.
As a result, 14 states have stepped in to provide limited periods of paid family leave (PFL), with the length and generosity varying by state.6 Researchers have found that PFL has helped the wives of care recipients remain working, although it has had only a limited impact on husbands.7 The value is larger for workers with a high school degree or less, suggesting that states with PFL could reduce the differential costs of caregiving. A limitation to many of the studies examining PFL, however, is that PFL is not restricted to those caring for older adults. PFL may be better suited for caregiving that is expected and of limited duration.
In short, employer-based leave policies, federal FMLA, and state PFL are beneficial for short caregiving periods but provide limited support for primary caregivers who provide care for longer periods. Additionally, many workers do not have access to these programs, and even when they do, take-up is low.8
Recently, some research has examined what caregivers actually need or want. Qualitative analysis revealed that family caregivers have diverse needs and recommendations, ranging from caregiver pay to improved access to respite care to medical training.9 Similarly, a recent AARP survey found that caregivers would find many policies – including income tax credits, caregiver pay, and partial paid leave – helpful.10 What is less clear is why take-up of existing programs is so low, which policies would be most beneficial, and whether different policies are more effective for different racial/ethnic groups. This study conducts four focus groups to examine if policy preferences vary by race/ethnicity, income, employment status, and whether the caregiver is the primary caregiver. It then uses quantitative analysis to see whether the rankings by focus group participants are consistent with the possible payoff of the policies.
Focus Groups Findings
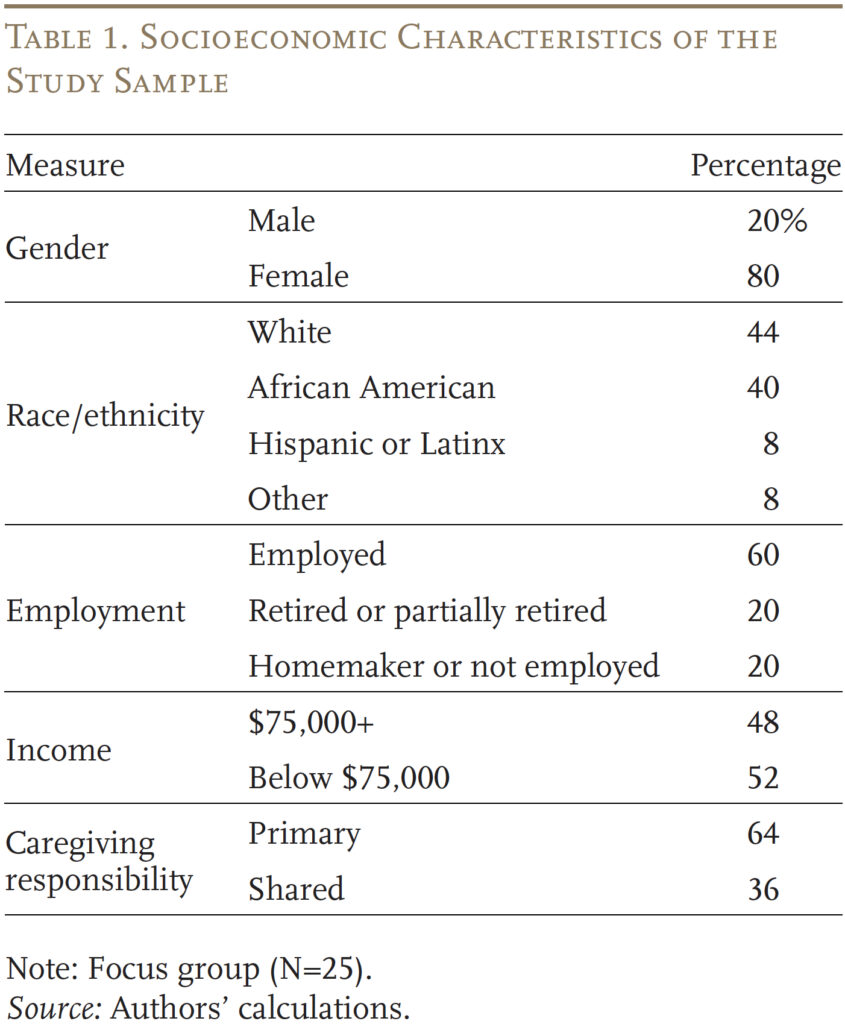
The focus groups included a total of 25 family caregivers. The discussions were conducted virtually to maximize accessibility, and a stipend of $135 was offered to all participants. To ensure representation of underserved communities, several groups were oversampled: Blacks, lower-income individuals, and men (see Table 1 for sample characteristics). The average age across all participants was 50, with a range from 26 to 67. Four focus groups were conducted, each comprising six to eight participants. Two of the four were high-income, and the other two were low-income. The focus groups were 75 minutes in length.
The focus group discussions centered on six policies: 1) paid family leave; 2) direct payment from the government for providing family care; 3) tax credits for providing care; 4) caregiver credits toward Social Security benefits; 5) paid respite care; and 6) reimbursements for caregiver out-of-pocket costs. The following provides a brief description of these policies and participants’ reactions.
(1) Paid Family Leave. As noted, while a federal program protects workers’ jobs if they take short leaves to care for family members, it is unpaid. Some states have paid leave programs that replace a portion of workers’ wages for a short period of time. The proposed policy described to focus group members would offer around 60 percent of wages for up to 12 weeks for workers caring for someone with a serious illness. Many respondents were aware of and noted the program’s positive aspects, but those who were not employed felt they would not benefit. Other concerns included the program’s limitations, such as benefit caps, the limited time that benefits are available, and lack of relevance to certain employment types. Self-employed individuals questioned its relevance, and working caregivers were more likely to highlight the need for job protection.
(2) Direct Payments for Caregiving. Most participants showed great interest in being paid directly for their caregiving time. They emphasized the immediate relief such payments could provide, especially in urgent situations, and how it could ease balancing work and caregiving. Concerns about this type of program included anticipated delays in receiving payments, the temporary nature of support, and accessibility issues like eligibility criteria and lengthy approval processes. Respondents suggested that it would be important to streamline approval processes and expand coverage to ensure equitable access.
(3) Tax Credit for Caregiving. An income tax credit for caregiving for an older adult interested fewer respondents, but some still found it relevant. Participants noted it might not benefit them if they do not pay taxes or need immediate assistance. Some found direct government payments far more helpful than a tax credit. Concerns about a tax credit approach included having to wait until tax season to receive the credit.
(4) Social Security Caregiver Credit. This policy involves counting caregiving time out of the labor force as “employment” for the purposes of accruing Social Security benefits.11 The idea of augmenting for caregivers unable to work outside the home was viewed positively by some participants. But, overall, few showed interest in this policy largely due to its focus on future, rather than immediate, financial needs. In terms of interest, higher-income caregivers found this policy more helpful than their lower-income counterparts. Suggestions for strengthening such an approach included combining immediate support with long-term benefits to better address caregivers’ financial needs.
(5) Paid Respite Care. Respite care allows caregivers a short-term break, either through the purchase of home care services or short-term residential care for the recipient.12 A few respondents showed interest in receiving paid respite care, seeing potential benefits in reducing their caregiving burden. The advantages they cited included improved time management and opportunities for self-care. Concerns focused on respite care quality, availability, and safety, and care recipient compliance. Overall, respondents found respite care helpful but emphasized the need for adequate payment to ensure high-quality providers.
(6) Reimbursements for Caregiver Costs. This policy involves covering caregiver spending on items such as home modifications and assistive devices, including ramps, accessible bedrooms, or cars modified for wheelchairs. Respondents saw significant benefits to such a policy, noting how these reimbursements could improve caregiving duties and quality of life. This policy was viewed as promising since insurance often does not cover such expenses. While some did not see immediate benefits for themselves, they recognized its potential for other caregivers. Concerns included the reimbursement process and the speed of receiving funds.
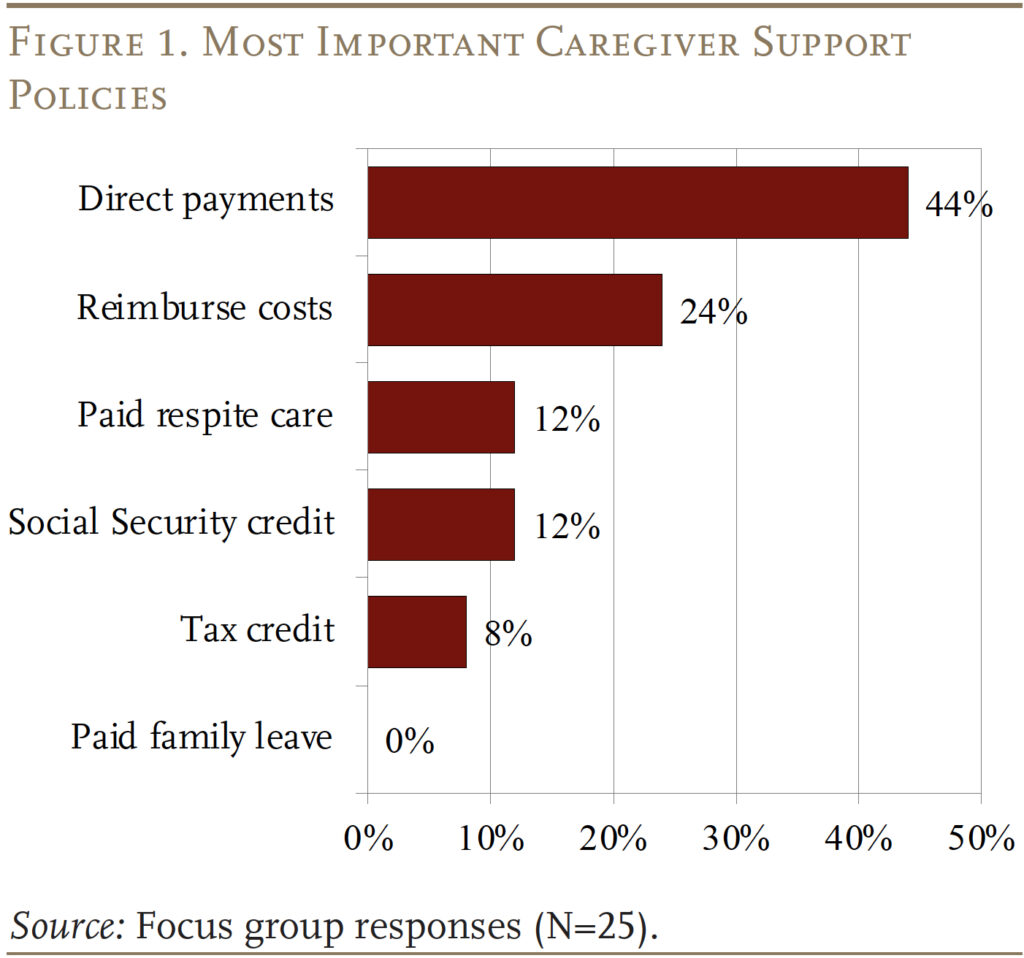
Of the six policies, being paid directly by the government for family caregiving was the most popular (see Figure 1). Specifically, 11 focus-group participants (44 percent) selected direct payments as the most helpful policy. This option was followed by reimbursing caregiving-related costs. Having paid respite care and receiving caregiver credit for Social Security benefits were each favored by only 2 participants (8 percent). None of the participants identified paid family leave as the most important policy.
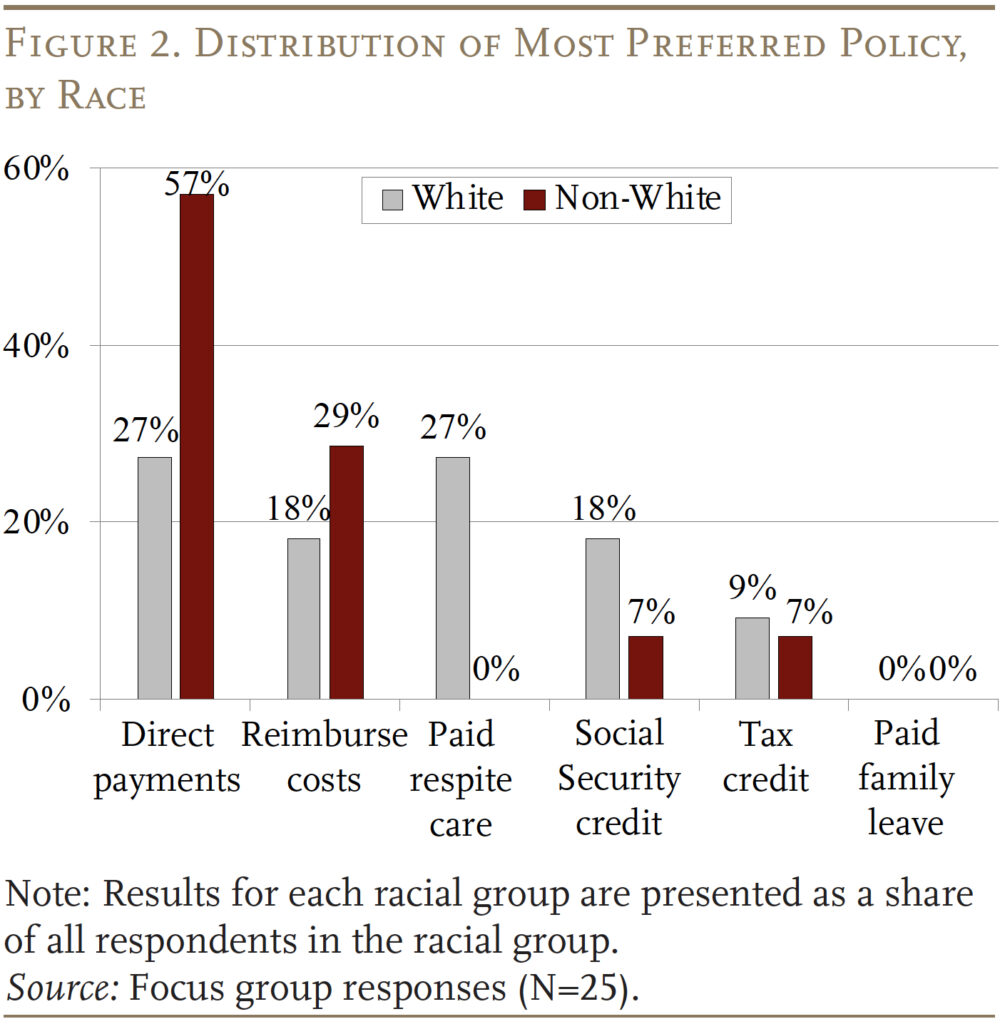
While the rankings of the most important policies were highly consistent across sociodemographic groups, some variations existed. The following discussion focuses on the pattern by race (see Figure 2); the full study also looks at variation by income, employment status, and caregiving burden. The most noticeable variation is that while both non-White and White caregivers ranked direct payments highly, it was by far the most favored policy for non-Whites. In contrast, non-Whites had no interest in respite care, while this policy did appeal to some Whites. Finally, while neither group was very enthusiastic about the Social Security caregiver credit, White caregivers saw more promise. One question, addressed below, is the extent to which this variation by race can be explained by the characteristics of the caregivers.
Findings from the Quantitative Analysis
The quantitative analysis supplements the interviews in two ways. First, it explores the extent to which the variation in preferences across groups can be explained by their characteristics. Second, the analysis can be used to compare the monetary value of the various policy options to the value perceived by focus group participants.
The analysis uses the National Health and Aging Trends Study (NHATS), linked with the National Study of Caregiving (NSOC), both for descriptive statistics and to calculate the probability that caregivers from different racial/ethnic groups face various financial challenges.
Characteristics by Race
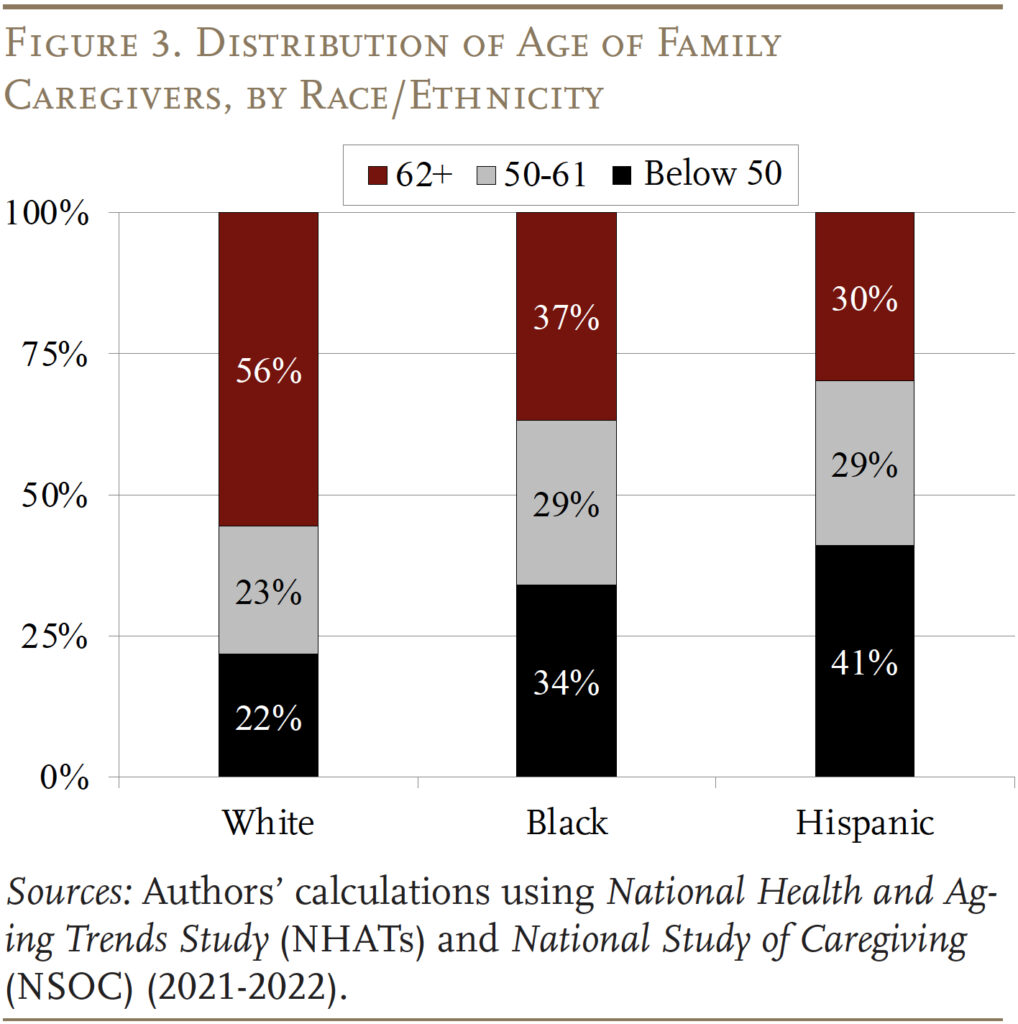
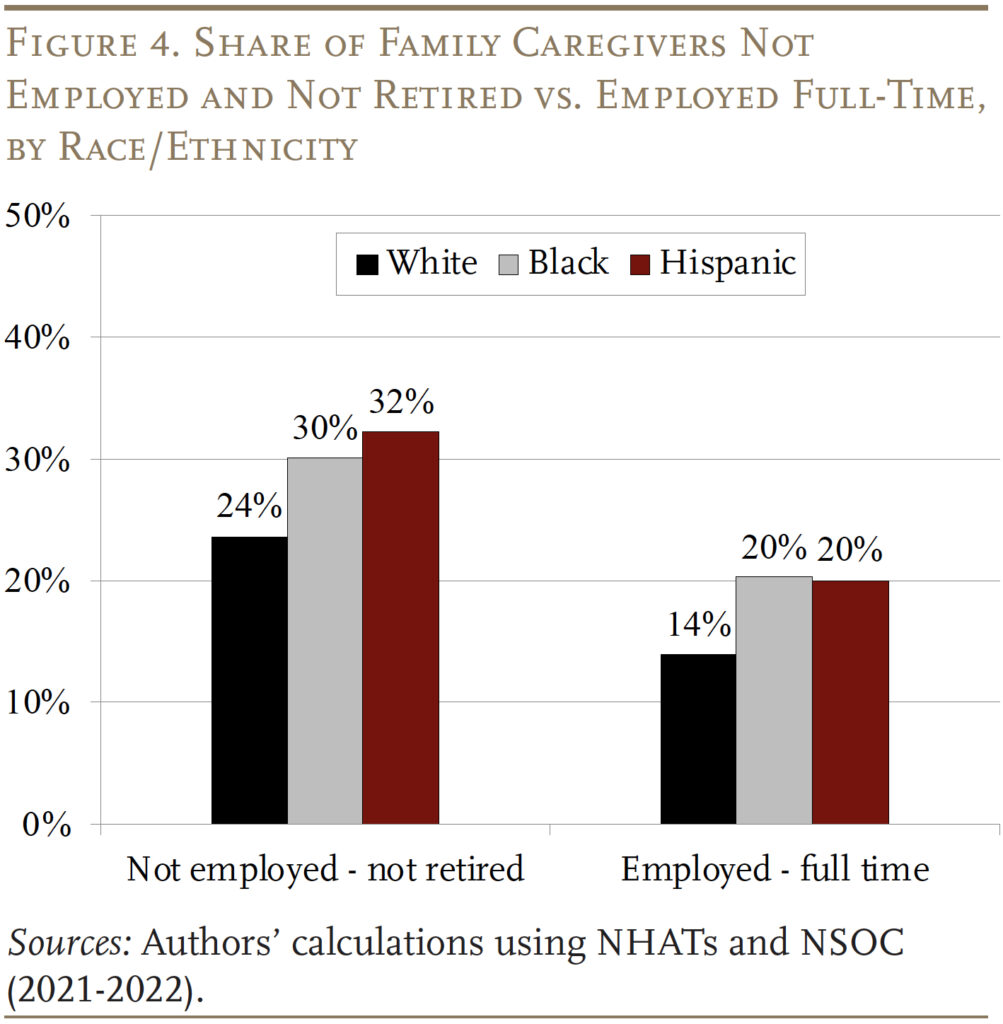
Data from NHATS/NSOC show that Black and Hispanic caregivers are younger and much more likely to be the children or grandchildren, rather than spouses, of care recipients compared to their White counterparts. As a result, 34 percent of Black and 41 percent of Hispanic caregivers are under age 50 relative to 22 percent of White caregivers (see Figure 3).
In addition, Black and Hispanic caregivers are much more likely to provide high levels of care, with close to half of them providing more than 60 hours a month compared to 31 percent for White caregivers. Consequently, Black and Hispanic caregivers are much more likely to be working part-time or have dropped out of the labor force despite being younger, which substantially impacts their lifetime earnings and their own financial security in retirement (see Figure 4). The combination of being younger, providing high levels of care, and being less likely to be employed helps explain non-Whites’ strong preference for direct payments and their lack of interest in Social Security credits relative to Whites.
Estimates of the Lifetime Value of the Policy Options
Finally, the analysis provides some back-of-the-envelope estimates of the financial benefit of the policies to see how they align with the preferences of focus group respondents. A brief summary of assumptions underlying these calculations is outlined below:
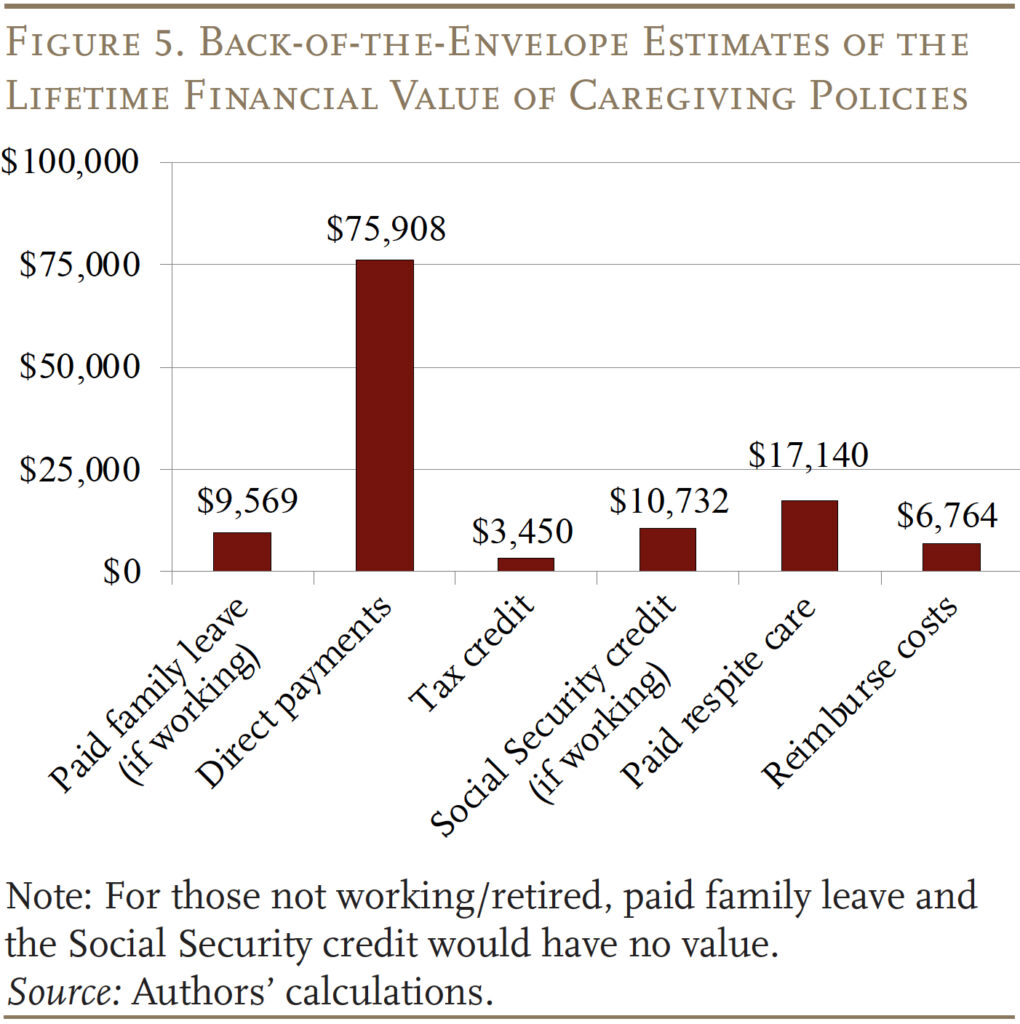
Paid Family Leave. State programs vary substantially in the share of wages replaced and the length of the payment period. The example used here assumes caregivers receive 60 percent of their wages for 12 weeks and earn the average wage in 2022 of $63,795, which equates to $9,569 a year. The theoretical lifetime value could be much higher since, technically, employees are eligible for the program every calendar year. However, it may be unlikely for workers to stay at the same employer if they take leave every year. Additionally, this policy would not provide any benefit for caregivers who were retired or had dropped out of the labor force.
Direct Payments for Caregiving. Some states pay family members a certain amount for providing care.13 Our analysis shows that caregivers do not change their labor force decisions unless they provide more than 60 hours of care per month. The assumption for this calculation is that such a caregiver is paid $15/hour. On average, family caregivers provide 74 hours of care a month, which would result in a payment of $11,000 per year. Since individuals on average provide care for 6.9 years, the lifetime value of this policy equates to almost $76,000.14
Tax Credit for Caregiving. The most relevant tax credit is the federal Credit for Other Dependents, which provides up to $500 for dependents of any age. The lifetime value of this credit is only around $3,500 for most family caregivers.
Social Security Caregiver Credit. This proposal typically involves replacing a person’s missing earnings with a credit equal to half of the average wage index for up to five years.15 Once they retire, their benefit will be slightly higher because they will have fewer zero years in their earnings history. This difference in annual benefits for receiving credit for up to five years is $1,172 a year, assuming caregivers claim at age 65. But since caregivers will not receive these benefits until they claim Social Security, the value has to be discounted back to age 50 at a discount rate of 3 percent, resulting in a value of about $10,700.16 The policy also would not benefit caregivers who are already retired.
Paid Respite Care. The assumed policy would cover one day of respite care per month; the annual value would be $1,140 for adult day care and $2,484 for a home health aide.17 The lifetime value is approximately $7,870 for adult day care and $17,140 for a home health aide.
Reimbursements for Caregiver Costs. Reimbursements on care-related items could cover costs that are generally not covered by insurance. Data from the NHATS/NSOC show that average out-of-pocket costs on these items are around $980 annually for caregivers who incur costs. The lifetime value of this policy is $6,764.
Figure 5 compares the potential financial value of the various policies for family caregivers. Being paid directly for providing care offers the highest value. Therefore, it is not surprising that it is one of the favorites among caregivers in our focus groups. Paid respite care, the third most popular policy among participants, provides the second highest financial value. Interestingly, while having out-of-pocket costs reimbursed ranked highly among focus group participants, the actual value of this policy is relatively low. But the financial relief is immediate, which many participants valued. Overall, the values assigned to the six policy options are fully consistent with the rankings provided by the focus-group participants.
Conclusion
The focus group discussions showed that the policies perceived to make the most significant difference for caregivers involved direct monetary compensation from the government, either by being paid for caregiving or through reimbursements for out-of-pocket costs. Conversely, the policy perceived as least beneficial was paid family leave or expanded sick leave. The responses align with our quantitative analysis, which shows that caregivers, particularly those from diverse backgrounds, incurred out-of-pocket costs for providing care and many had to cut back on work or leave the labor force altogether. Overall, these results provide valuable insights for policymakers on the most effective interventions for alleviating the financial burdens associated with caregiving.
References
AARP. 2023. “Valuing the Invaluable 2023 Update: Strengthening Supports for Family Caregivers.” Washington, DC: Public Policy Institute.
Bana, Sarah H., Kelly Bedard, and Maya Rossin-Slater. 2020. “The Impacts of Paid Family Leave Benefits: Regression Kink Evidence from California Administrative Data.” Journal of Policy Analysis and Management 39(4): 888-929.
California Employment Development Department. 2023. “Paid Family Leave (PFL) Program Statistics.” Sacramento, CA.
Cohen, Marc, Claire Wickersham, Christian Weller, Anqi Chen, and Brandon Wilson. 2024. “Which LTSS Financial Support Policies Are Preferred among Caregivers and Can They Reduce Racial/Ethnic Disparities in Retirement Security?” Working Paper 2024-17. Chestnut Hill, MA: Center for Retirement Research at Boston College.
Coile, Courtney, Maya Rossin-Slater, and Amanda Su. 2022. “The Impact of Paid Family Leave on Families with Health Shocks.” Working Paper 30739. Cambridge, MA: National Bureau of Economic Research.
Crandall-Hollick, Margot L. and Connor F. Boyle. 2021. “Child and Dependent Care Tax Benefits: How They Work and Who Receives Them.” R44993. Washington, DC: Congressional Research Service.
Ettner, Susan L. 1996. “The Opportunity Costs of Elder Care.” Journal of Human Resources 31(1): 189-205.
Fahle, Sean and Kathleen M. McGarry. 2017. “Caregiving and Work: The Relationship Between Labor Market Attachment and Parental Caregiving.” Working Paper 2017-356. Ann Arbor, MI: Michigan Retirement Research Center.
Favreault, Melissa M. and Brenda C. Spillman. 2018. “Tax Credits for Caregivers’ Out-of-Pocket Expenses and Respite Care Benefits: Design Considerations and Cost and Distributional Analyses.” Research Report. Washington, DC: Urban Institute.
Feinberg, Lynn Friss. 2019. “Paid Family Leave: An Emerging Benefit for Employed Family Caregivers of Older Adults.” Journal of the American Geriatrics Society 67(7): 1336-1341.
Hartmann, Heidi I. and Jeffrey Hayes. 2021. “Estimating Benefits: Proposed National Paid Family and Medical Leave Programs.” Contemporary Economic Policy 39(3): 537-556.
Jacobs, Josephine C., Courtney H. Van Houtven, Audrey Laporte, and Peter C. Coyte. 2017. “The Impact of Informal Caregiving Intensity on Women’s Retirement in the US.” Population Ageing 10: 159-180.
Johns Hopkins University, Bloomberg School of Public Health and University of Michigan, Institute for Social Research. National Study of Caregiving, 2021-2022.
MedicaidLongTermCare.org. 2024. “Getting Paid as a Caregiver.”
Nadash, Pamela, Eileen J. Tell, and Taylor Jansen. 2023. “What Do Family Caregivers Want? Payment for Providing Care.” Journal of Aging & Social Policy 1-15.
Nadash, Pamela, Eileen Tell, Carol Regan, Taylor Jansen, Andrew Alberth, and Marc Cohen. 2021. “Findings from RAISE Act Research: Family Caregiver Priorities.” Innovation in Aging 5(1): 63-64.
National Health and Aging Trends Study. 2021-2022. Produced and distributed by www.nhats.org with funding from the National Institute on Aging (Grant Number NIA U01AG032947).
Quinby, Laura D. and Robert L. Siliciano. 2021. “Implications of Allowing US Employers to Opt Out of a Payroll-Tax-Financed Paid Leave Program.” Special Report. Chestnut Hill, MA: Center for Retirement Research at Boston College.
Reinhard, Susan C., Selena Caldera, Ari Houser, and Rita B. Choula. 2023. “Valuing the Invaluable 2023 Update: Strengthening Supports for Family Caregivers.” Washington, DC: AARP Public Policy Institute.
Skira, Meghan M. 2015. “Dynamic Wage and Employment Effects of Elder Parent Care.” International Economic Review 56(1): 63-93.
Truskinovsky, Yulya and Nicole Maestas. 2018. “Caregiving and Labor Force Participation: New Evidence from the American Time Use Survey.” Innovation in Aging 2(1): 580.
U.S. Congress. 2023. “S.1211 – Social Security Caregiver Act of 2023.” Introduced in the Senate April 19, 2023.
Van Houtven, Courtney Harold, Norma B. Coe, and Meghan M. Skira. 2013. “The Effect of Informal Care on Work and Wages.” Journal of Health Economics 32(1): 240-252.
Wolff, Jennifer L., Brenda C. Spillman, Vicki A. Freedman, and Judith D. Kasper. 2016. “A National Profile of Family and Unpaid Caregivers Who Assist Older Adults with Health Care Activities.” JAMA Internal Medicine 176(3): 372-379.
Endnotes
- Cohen et al. (2024). ↩︎
- See Reinhard et. al (2023). ↩︎
- See Ettner (1996); Skira (2015); Van Houten, Coe, and Skira (2013); Fahle and McGarry (2017); and Truskinovsky and Maestas (2017). ↩︎
- See Wolff et al. (2016); Feinberg (2019); and Jacobs et al. 2017). ↩︎
- See Favreault and Spillman (2018) and Crandall-Hollick and Boyle (2021). Caregivers who do not qualify for the Child and Dependent Care Tax Credit can apply for the Credit for Other Dependents, but the maximum amount is only $500 per year. ↩︎
- See Quinby and Siliciano (2021) and Coile, Rossin-Slater, and Su (2022). ↩︎
- See Coile, Rossin-Slater, and Su (2022). ↩︎
- For instance, in 2022 only 49,231 caring claims were filed with the California PFL program, representing about 1 percent of all informal caregivers in the state (California Employment Development Department 2023; Bana, Bedard, and Rossin-Slater 2020; Reinhard et al. 2023; and Hartmann and Hayes 2021). ↩︎
- See Nadash, Tell, and Jansen (2023) and Nadash et al. (2021). ↩︎
- AARP (2023). ↩︎
- Several proposals aim to help workers who have to drop out the labor force temporarily. Many are focused on providing parents who care for children credit, but the Social Security Credit Act (which has been introduced in several recent legislative sessions), would apply to caregivers for children or adults. ↩︎
- The settings in which respite care is provided can vary by state. For example, Massachusetts has a grant that allows home-and-community-based services, such as certified home health agencies and day programs to provide respite care for caregivers. Several states also provide adult day care services, which although not specifically respite care, can help caregivers get a break. ↩︎
- MedicaidLongTermCare.org (2024). ↩︎
- Black and Hispanic caregivers generally provide more hours of care (91 and 112 hours, respectively) over a longer period of time (7.1 and 7.3 years, respectively). ↩︎
- U.S. Congress (2023). ↩︎
- In addition to not providing immediate financial relief to caregivers, this policy also would not benefit caregivers with more than 35 years of earnings because lower or zero earning years outside of the highest 35 are already excluded. ↩︎
- Data from Genworth show that the median price for adult day care is $95/day and a home health aide is $207/day. ↩︎


