


Why Do Desired Stock Allocations Differ from Actual Holdings?

The brief’s key findings are:
- As people increasingly rely on their 401(k) assets for retirement, their exposure to market risk is a key issue.
- A new survey shows that older retirement investors tend to be overly pessimistic about stocks, which likely affects their preferred asset allocation.
- But comparable data suggest that they actually hold more in stocks than they would prefer, perhaps due to the growth of target date funds as 401(k) defaults.
- So, while investors may have more in stocks than they seem to want, it probably helps them given their overly pessimistic views.
Introduction
As people approach and enter retirement, they face an array of risks – including the risk of outliving their assets, the risk of a large healthcare spending shock, inflation risk that erodes their income and wealth, and market risk that directly affects the value of their assets. Market risk has become increasingly salient as employer-sponsored retirement plans have shifted from defined benefit (DB) to 401(k)-type arrangements, where households bear the brunt of poor outcomes. The questions are, how do retirement investors view market risk and how do those views relate to their desired and actual holdings of risky assets?
This brief, which is based on a new paper, first reports the results of a recent survey on how investors perceive market risk.1 The survey covers older households (ages 48-78) who are dependent on their assets for support in retirement ($100,000+ in investable assets and no DB plan). The analysis then explores the relationship between desired holdings in risky assets reported in the new survey to actual holdings reported in two major household surveys – the Health and Retirement Study and the Survey of Consumer Finances. This approach aims to determine the relative importance of investor preferences versus institutional arrangements – namely, the target date funds that are often the default investment option in 401(k) plans.
The discussion proceeds as follows. The first section provides some background on market risk, and the second section briefly summarizes a portion of the vast literature on the optimal holdings of risky assets and households’ perceptions of the riskiness of stocks. The third section briefly describes the findings from the new survey, and the fourth section explores the relationship between desired and actual holdings of risky assets.
The final section concludes that investors’ desired allocations to risky assets tend to be lower than their actual allocations. The low level of desired holdings is consistent with households’ overly pessimistic views of stock returns, and the higher level of actual holdings likely reflects the target-date-fund defaults in 401(k) plans. In short, people seem to be holding more equities than they want, but that pattern is probably good for them.
What Does Market Risk Mean for Wealth Accumulation?
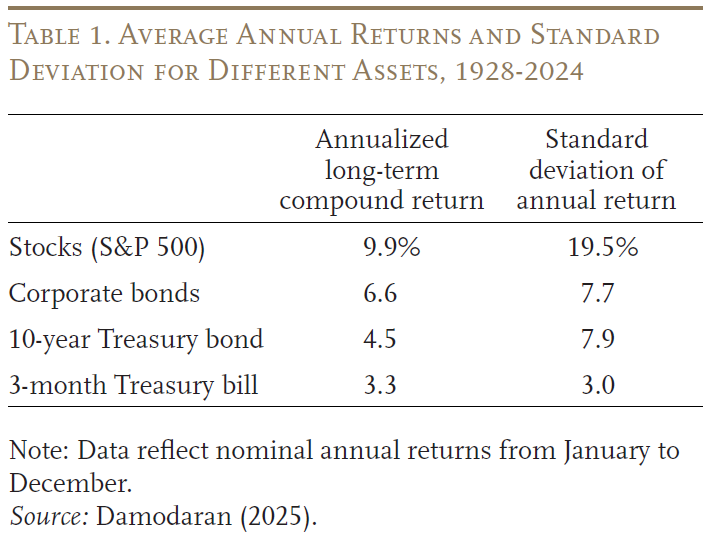
In conventional investment portfolios, most financial market risks stem from stocks. While over the long term, stocks have dramatically outperformed fixed-income assets, their returns are much less certain, as evident by the large standard deviation of annual returns (see Table 1). The key issue is how the risk associated with stock returns ultimately affects the value of invested assets in retirement and the spending level those assets can support.
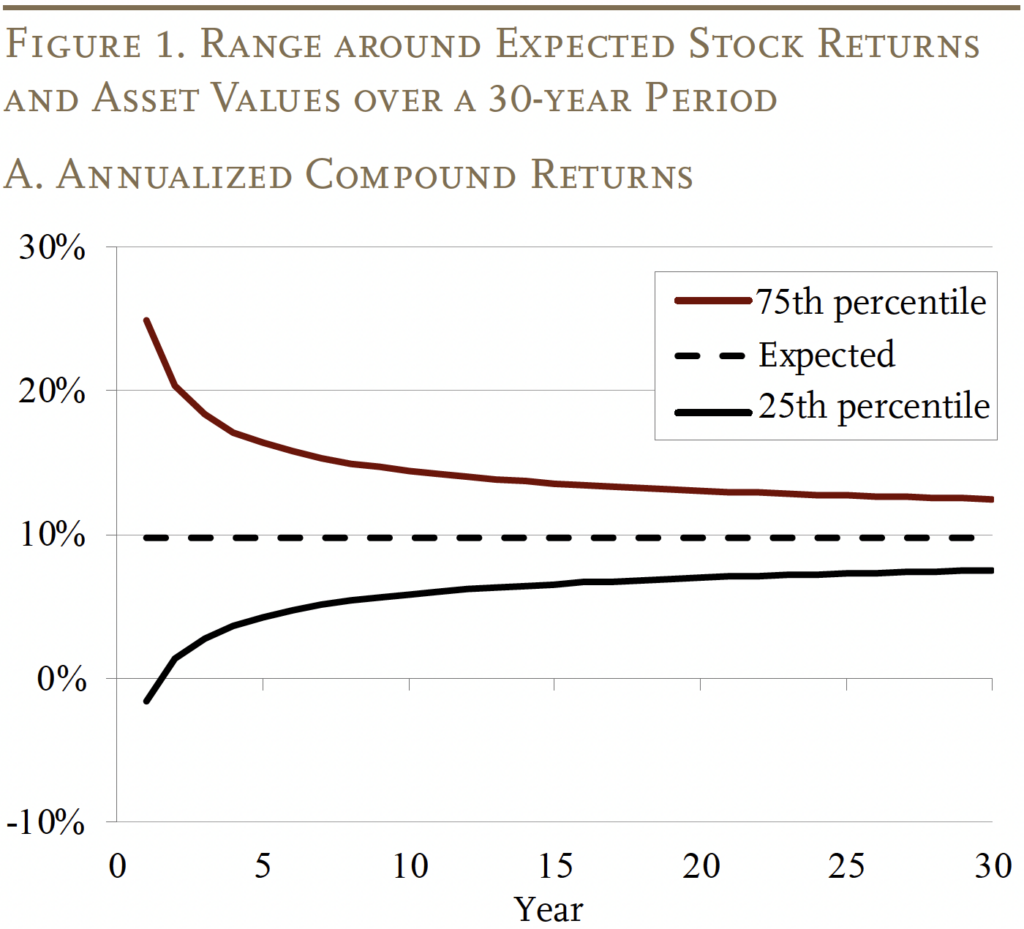
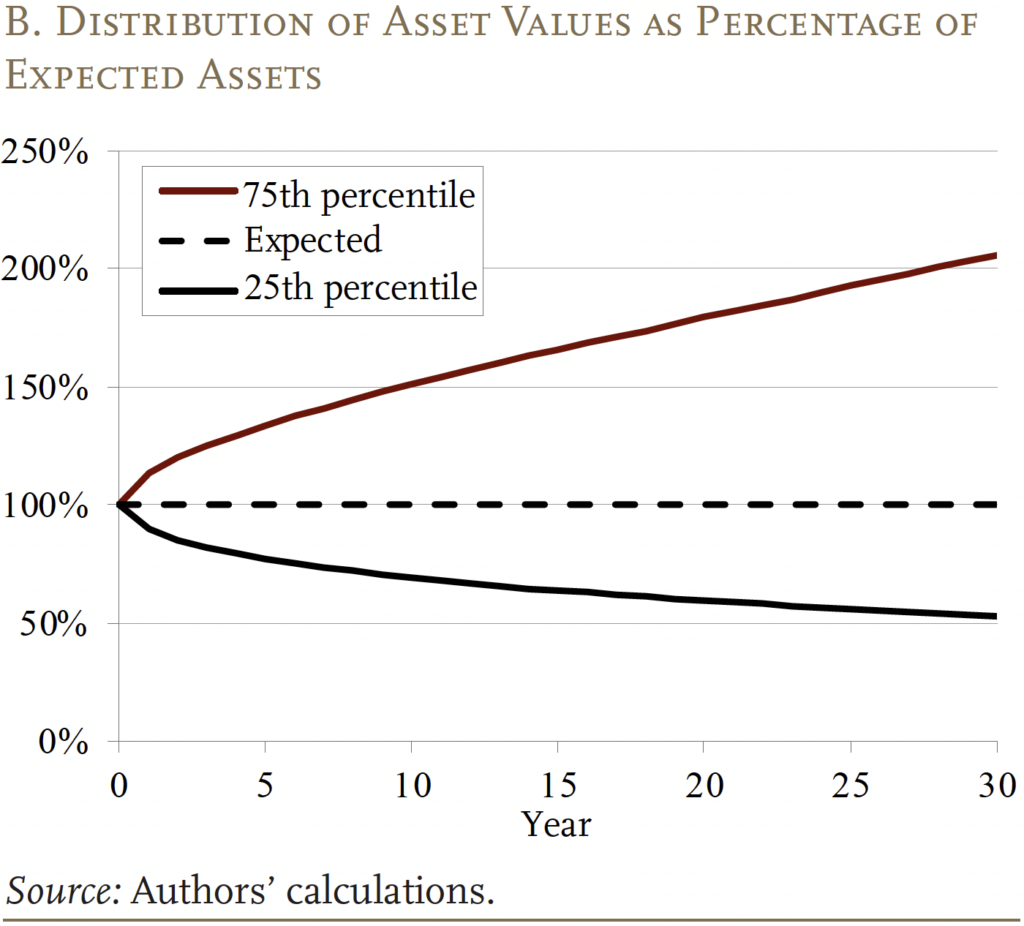
A common fallacy is that risk declines with longer investment horizons because fluctuations in short-term returns average out in the long run. In fact, even if annualized stock returns converge to long-term expectations over time (see Figure 1a), the range of wealth accumulation widens as a percentage of expected wealth (see Figure 1b). More specifically, over a 15-year period, the stock investor faces a 25-percent chance that their assets could be 60 percent more than what they expect, and a 25-percent chance that their assets could be 40 percent less than what they expect. Extending the period to 30 years, investors face a 25-percent chance that their assets could be 100 percent more than expected or 50 percent less.2
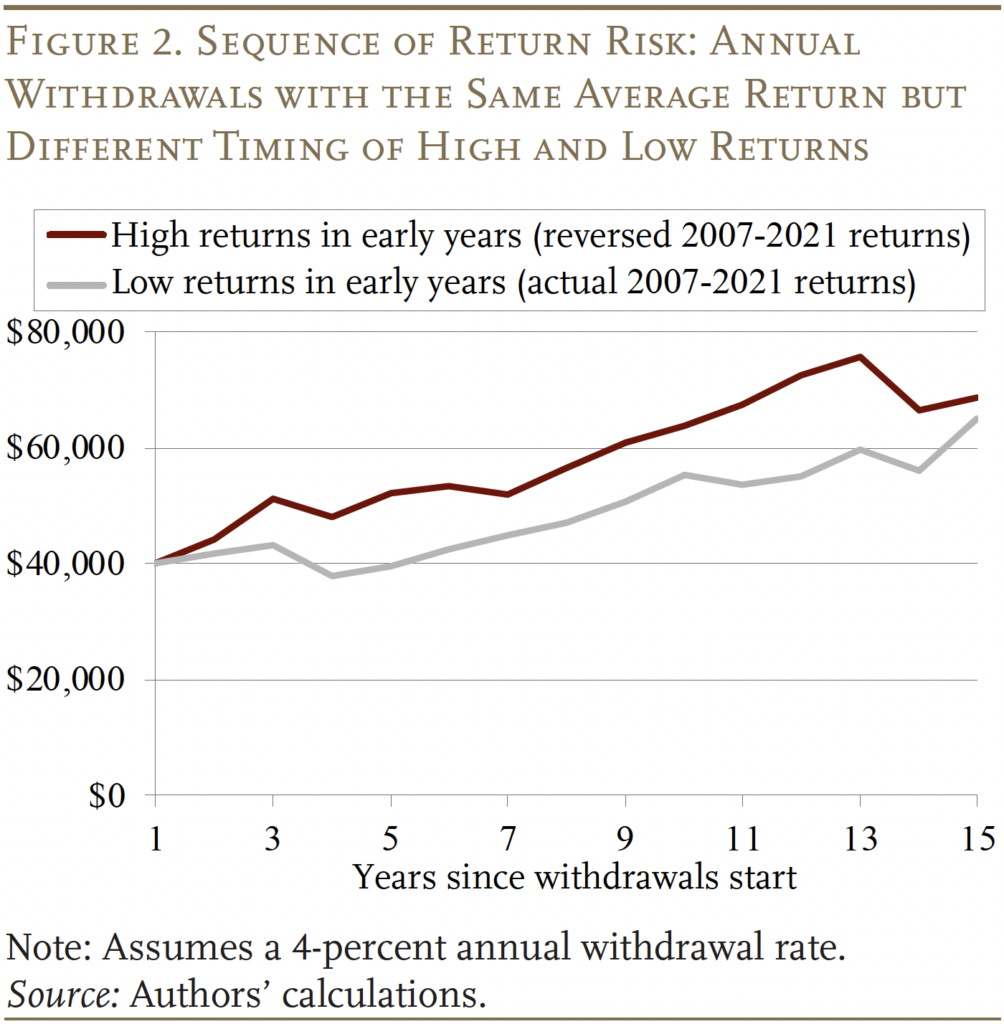
In addition to the uncertainty in asset values over the long term, once retirement investors start withdrawing their financial assets, they also face so-called “sequence-of-returns” risk. That is, in the presence of regular withdrawals from the portfolio, returns early in the period have greater effects than later returns on total retirement income. This effect can be seen in Figure 2, which assumes a starting portfolio of $1 million invested in a 50-50 stock/bond portfolio and a constant withdrawal rate of 4 percent. The exercise compares the impact on annual withdrawals under two stylized return paths with the same average annual return: 1) the historical returns from 2007-2021, with lower returns early due to the Great Recession and higher returns later due to the strong stock market (gray line); and 2) the same return sequence in reverse order (red line). The comparison shows that, in the scenario with worse returns in the early years, a retiree sticking with the 4-percent withdrawal method would have about 10- to 20-percent lower annual withdrawals.
In short, financial risk really matters for well-being in retirement. The next issue is what the literature says about how individuals view the risk associated with investing in stocks and what economists have to say about managing this risk.
Optimal Investing and Individual Perceptions
In terms of how to manage the risk associated with equity investment, it is helpful to start with the seminal work by Samuelson (1969) and Merton (1969), in which the household has no labor income and withdrawals from financial assets are the only source of income. Such a model results in a clear and simple rule for optimal asset allocation: investors should maintain a constant share in risky assets throughout their lifetime regardless of age and initial wealth levels. That share depends on three factors: 1) the expected return of risky assets relative to that of risk-free assets (i.e., the stock risk premium); 2) the volatility of stock returns; and 3) the risk aversion level of the investor.3
A crucial extension to this basic portfolio choice model is introducing labor income.4 Since human capital generates a stream of future labor income that is typically considered a closer substitute to bonds than to stocks, households with greater human capital (in the sense of the present value of total future labor income) should hold a greater proportion of their financial wealth in risky assets. Because human capital declines with age, the share of risky assets in total financial wealth should decline as one approaches retirement. This framework underlies the familiar recommendation offered by financial advisors and the pattern of glide paths in target date funds.5
A vast array of factors can affect households’ tolerance for risk and willingness to invest in stocks – whether they own a home, the state of their health, concern about outliving their resources, and a desire to leave a bequest. Incorporating these factors into the analysis can alter the asset allocation paths predicted by basic models. An extensive literature has attempted to estimate the impact of these factors on the willingness to hold stocks, and these studies are summarized in the full paper.
A different type of consideration – and one important for this analysis – can also affect people’s willingness to invest in stocks – namely, their expectations about stock returns and market volatility. As one would expect, the empirical evidence confirms that positive expectations about the stock market are associated with greater stock ownership.6 Interestingly, one study finds that beliefs account for twice as much variation in observed portfolio holdings as risk aversion.7
Expectations about returns and volatility, however, are fundamentally different from the other factors discussed above in that the expectations can be compared with objective measures of performance to determine their accuracy. Indeed, the literature suggests households tend to have much lower expectations of stock market gains and higher expectations of volatility than historical averages. More specifically, research using the Health and Retirement Study (HRS) has consistently found that individuals tend to underestimate the likelihood of positive stock market performance when compared to historical data.8 Similarly, research based on the University of Michigan’s Survey of Consumer Confidence data and the Gallup Investor Survey finds that individuals regularly underestimate stock market performance.9 In addition to underestimating stock returns, individual investors also significantly overestimate market volatility and the probability of severe market downturns.
In short, the literature provides the theoretical basis for today’s target date funds where the holdings of risky assets decline as people age and also suggests that, if left on their own, investors’ negative assessment of returns and volatility would lead them to hold too little in stocks. The new survey of retirement investors can serve as a basis for exploring the relationship between households’ preferences for investing in stocks and their actual holdings.
Investor Survey
In the fall of 2024, Greenwald Research interviewed online 1,016 individuals ages 48-78 with $100,000+ in investable assets and a role in the financial decision-making of their households. To focus on those most reliant on their investable assets in retirement, the new survey deliberately under-sampled those with a DB plan.
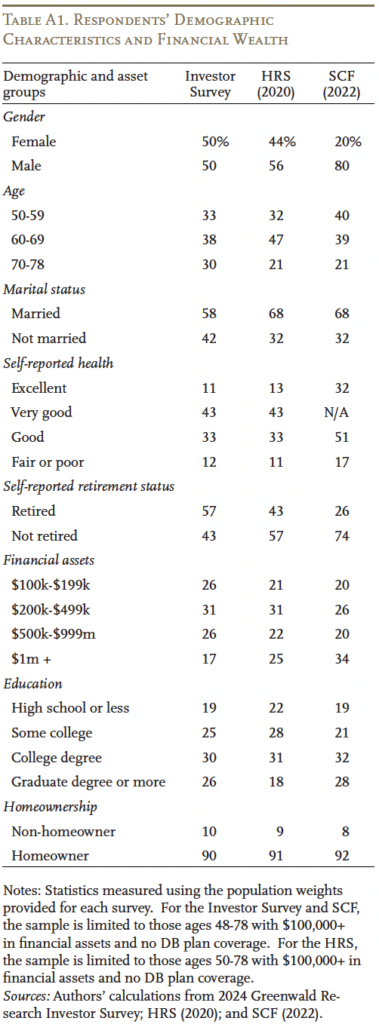
The survey began with questions on the demographic and financial characteristics of each respondent – such as age, marital status, total financial assets, and homeownership. This information is generally consistent with that from other household surveys such as the HRS and the Federal Reserve’s Survey of Consumer Finances (SCF) (see Appendix Table A1). The survey also covered topics of particular relevance for older and wealthier individuals, such as the amount that individuals hope to leave as a bequest and whether respondents have set aside any funds for future long-term care expenses.
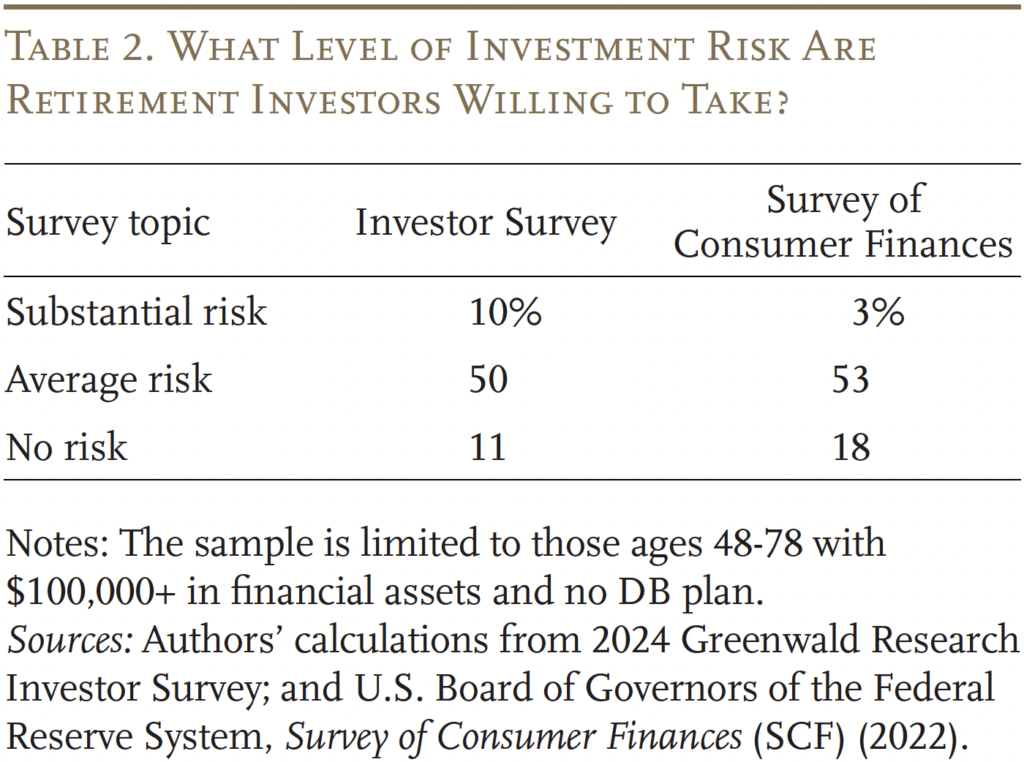
The new Investor Survey also contained information on respondents’ subjective preferences, beliefs, and concerns related to market risk and, crucially for this analysis, solicited their desired – rather than actual – asset allocation. On the topic of risk preference, the survey asked about the level of investment risk the respondents are willing to take. Albeit a simple question, research shows that its result is reasonably correlated with more comprehensive risk preference measures.10 The results show general alignment between the Investor Survey and the SCF (see Table 2 for the midpoint and extremes of the risk preference question in each survey).11
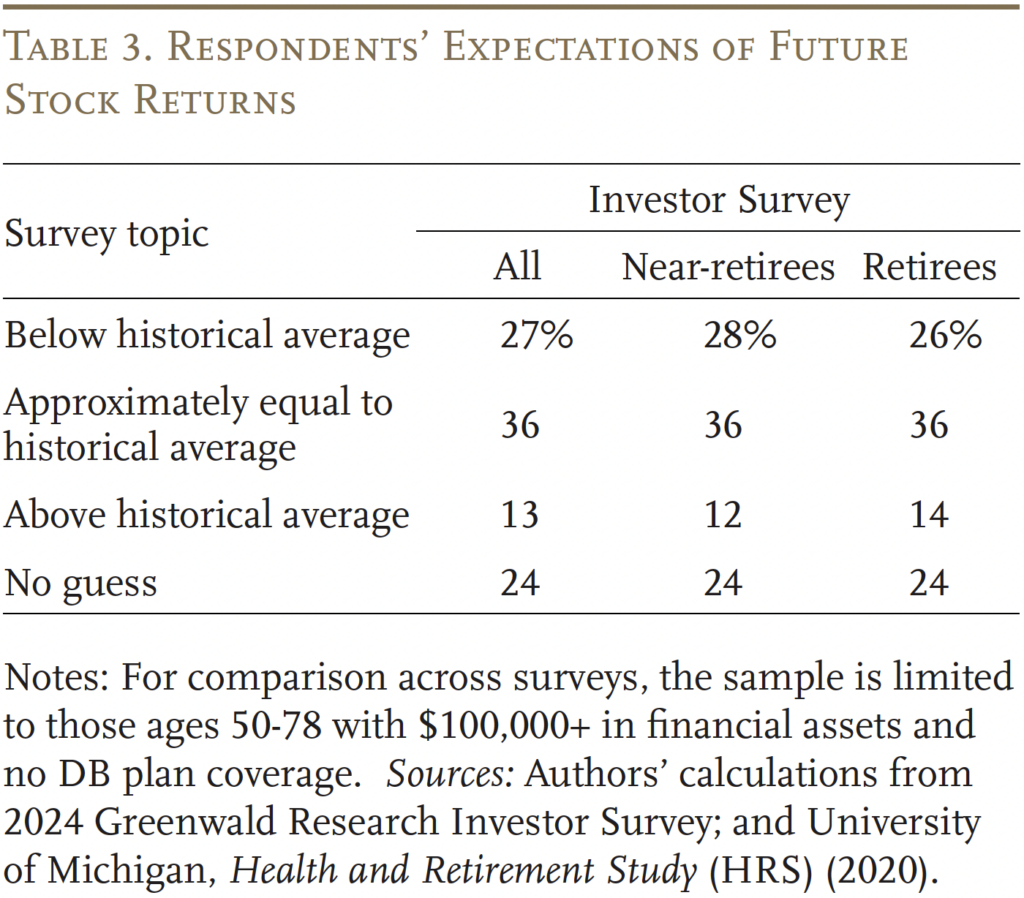
To assess respondents’ expectations regarding future stock returns, the survey asks whether they think average annual returns will be below, equal to, or above the long-term historical average. Roughly one-third of the respondents think future returns will be close to the historical average; and respondents with a pessimistic view about future returns outnumber those with an optimistic view by about two to one (see Table 3). Interestingly, about a quarter of respondents report that they do not know enough to make a judgement. As a point of comparison, the HRS asks individuals to provide their best guess on whether the stock market will go up in the next year. The average response is reliably around 60 percent. But historically, the stock market has gone up about 75 percent of the time – suggesting a somewhat pessimistic view of future stock returns relative to history in the HRS as well. The next section explores how individuals’ expected stock returns fit into the question of desired versus actual allocation to stocks.
Desired vs. Actual Stock Allocation
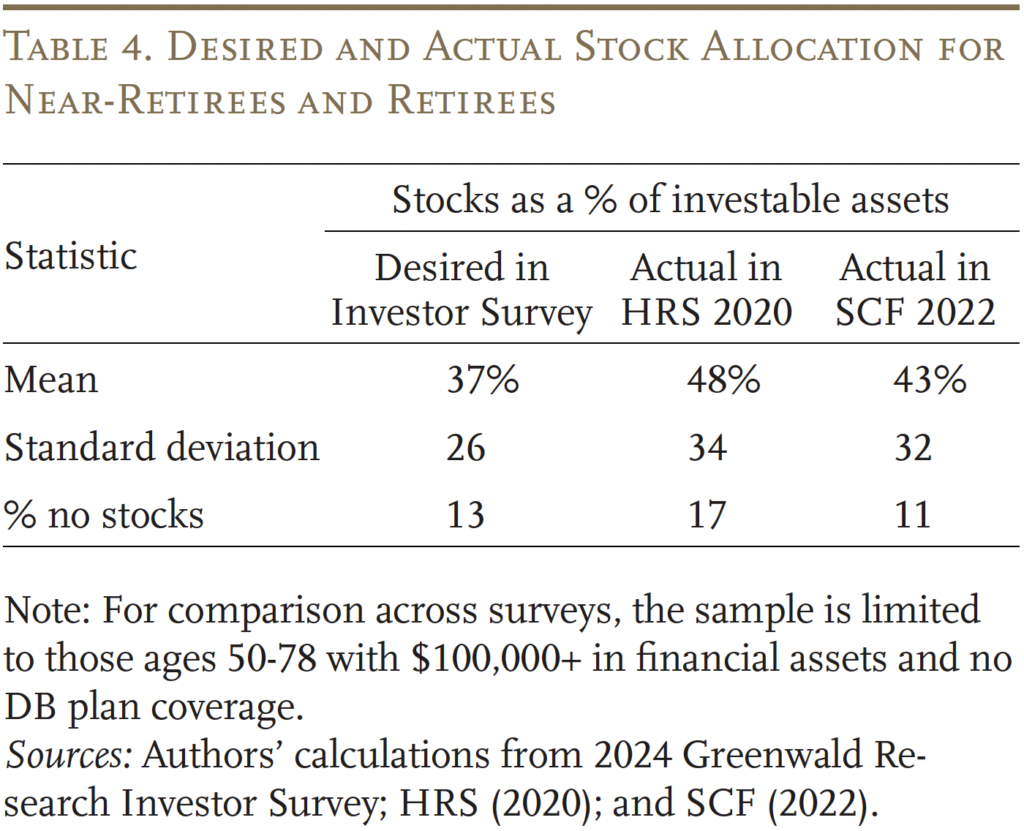
Table 4 compares the average desired allocation across both near-retirees and retirees to the actual allocation for a similar sample in both the HRS and the SCF. The Investor Survey shows that the average desired allocation is lower than the actual allocation reported in both the HRS and SCF.12 The variation in desired allocation is also smaller than for actual allocation. Interestingly, a meaningful fraction of retirement investors desire to avoid stocks entirely – and actually do so in practice.
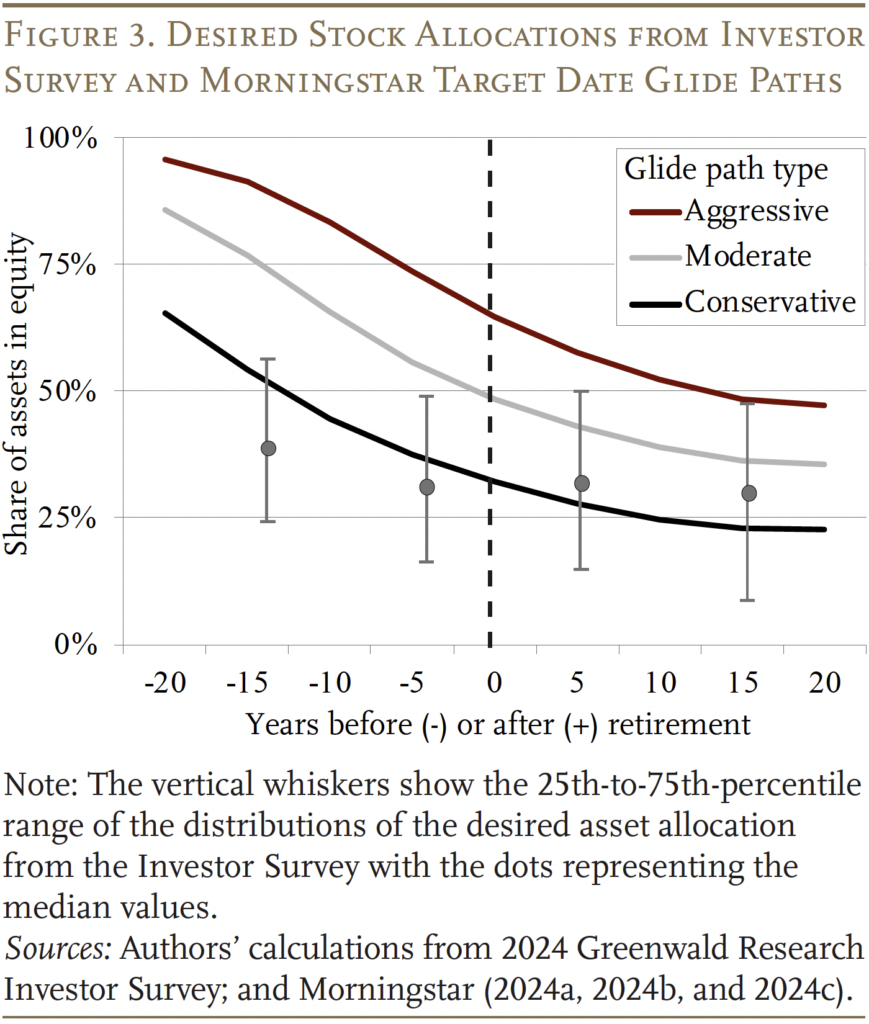
One likely reason for the difference between desired and actual allocations are the defaults embedded in the retirement system – namely, target date funds. Figure 3 shows three glide paths corresponding to the aggressive, moderate, and conservative variants of Morningstar Lifetime Allocation Indexes, which are constructed presuming rational investors who have different risk preferences and labor income risk.13 The figure also includes the distribution of the desired stock allocation (vertical lines) from the Investor Survey for each 10-year interval. The bottom of each vertical line represents the 25th percentile, the mid-point represents the median, and the top represents the 75th percentile.14 While the desired allocation exhibits substantial variation, the median hews closest to the conservative path, with the median for younger near-retirees (more than 10 years away from their expected retirement age) falling about 15 percentage points below the conservative allocation. If the moderate glide path is the common default, it would help explain the higher-than-desired allocation. Interestingly, the average actual allocation in the HRS – 48 percent – is quite similar to the allocation for those near retirement under the moderate glide path.
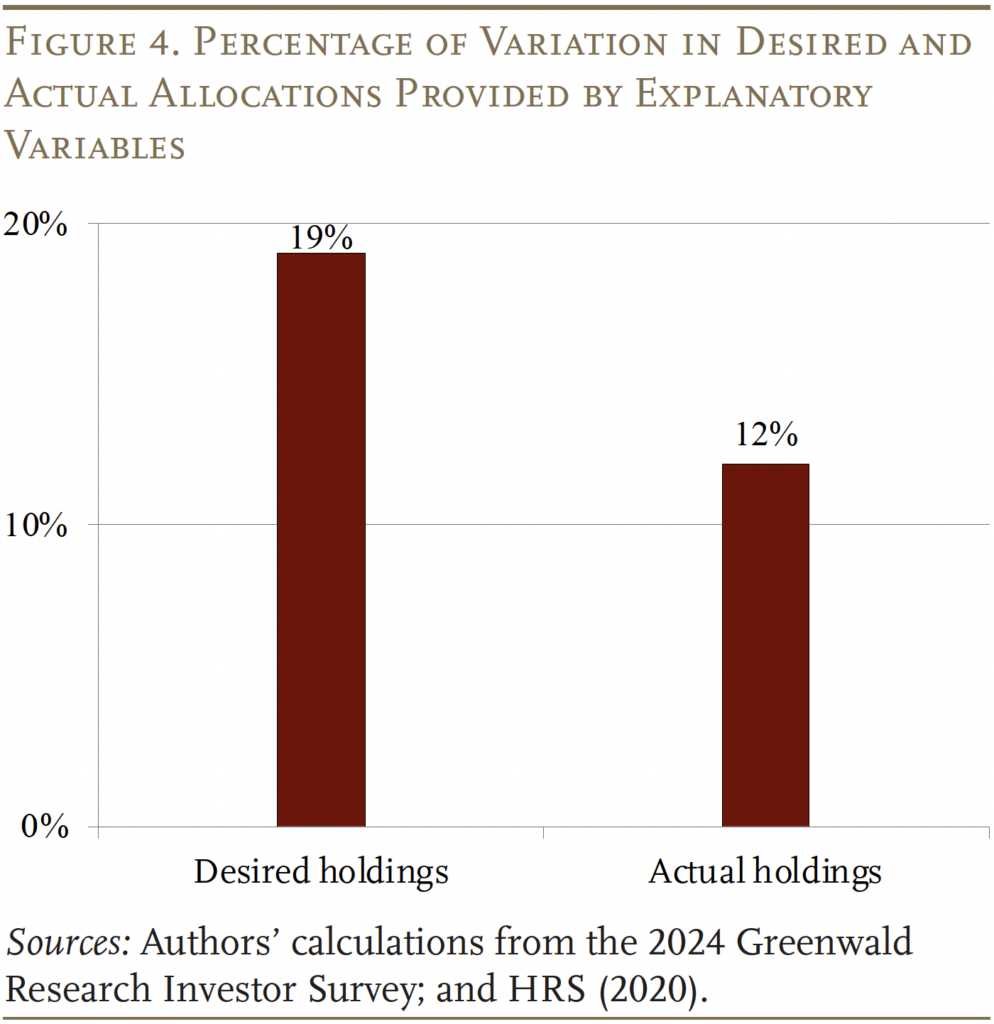
Another way to support the case that target date funds are controlling the action is to look at the explanatory power of variables related to portfolio choice. If the target date plans were the key lever, one would expect the individual preferences and characteristics that are related to portfolio choice in the literature to better explain the variation in desired allocation than in actual allocation. Unfortunately, no existing survey – including the new Investor Survey – asks individuals about both their desired and actual allocation, so the exercise requires data from both the Investor Survey to explain desired allocation and the HRS to explain actual allocation.15 While the two regressions include the same set of conceptual determinants of allocation identified in the literature, they rely on different raw variables to reflect each determinant.16
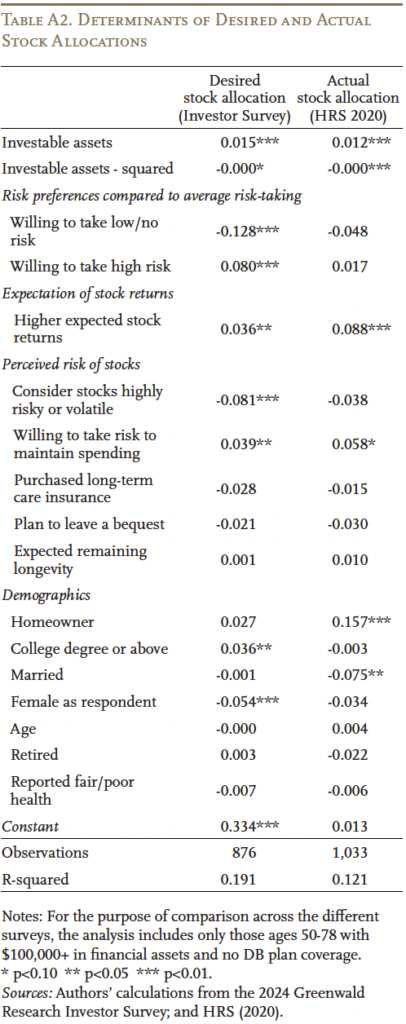
The regression results are presented in Appendix Table A2. Financial wealth and subjective factors, such as risk preferences, return expectations, and perceived risk of stocks play a major role in explaining both desired and actual allocations – but the relationships are generally much stronger for desired allocation.17 Overall, the regression using the Investor Survey explains 19 percent of the variation in desired allocation, while the regression using the HRS explains 12 percent of the variation in actual allocation (see Figure 4). These results suggest that the desired allocation is a truer reflection of individual preferences.
The finding that the actual allocation to stocks exceeds the desired allocation is not necessarily bad news. As noted, investors underestimate the return and overestimate the volatility of stocks, so their desires are based on a faulty assessment. A more accurate assessment would have led to higher desired holdings – much closer to that provided by target date funds.
Conclusion
When considering the challenge of managing market risk for retirement investors, existing data and literature can be used to illustrate the impact of variable returns on their wealth accumulation and withdrawals and identify the key factors affecting household decisions on risk-taking. Existing research, though, focuses on actual holdings of risky assets, as opposed to desired holdings. But actual stock holdings may be more reflective of institutional arrangements, such as target date funds in 401(k) plans, than of individual preferences.
To support that contention, this study relied on data from a new survey covering retirement investors ages 48-78 with total investable assets of $100,000+. The findings show that desired allocation to risky assets tends to be lower than actual holdings. The low level of desired holdings is consistent with households’ overly pessimistic views of stock returns, and the higher level of actual holdings likely reflects the default allocations in 401(k) plans – namely target date funds. In short, people seem to be holding more equities than they want, but that pattern is probably good for them.
References
Amromin, Gene and Steven A. Sharpe. 2012. “From the Horse’s Mouth: How Do Investor Expectations of Risk and Return Vary with Economic Conditions?” Working Paper 2012-08. Chicago, IL: Federal Reserve Bank of Chicago.
Aubry, Jean-Pierre and Yimeng Yin. 2025. “Do Desired Stock Allocations Differ from Actual Holdings?” Working Paper 2025-9. Chestnut Hill, MA: Center for Retirement Research at Boston College.
Beutel, Johannes and Michael Weber. 2022. “Beliefs and Portfolios: Causal Evidence.” Research Paper 22-08. Chicago, IL: The University of Chicago, Booth School of Business.
Bodie, Zvi. 1995. “On the Risk of Stocks in the Long Run.” Financial Analysts Journal 51(3): 18-22.
Bodie, Zvi, Robert C. Merton, and William F. Samuelson. 1992. “Labor Supply Flexibility and Portfolio Choice in a Life Cycle Model.” Journal of Economic Dynamics and Control 16(3-4): 427-449.
Boyd, Donald J. and Yimeng Yin. 2017. “Appropriateness of Risk-Taking by Public Pension Plans.” Albany, NY: Nelson A. Rockefeller Institute of Government.
Damodaran, Aswath. 2025. Historical Returns on Stocks, Bonds and Bills: 1928-2024. New York, NY: New York University, Stern School of Business.
Dominitz, Jeff and Charles F. Manski. 2007. “Expected Equity Returns and Portfolio Choice: Evidence from the Health and Retirement Study.” Journal of the European Economic Association 5(23): 369-379.
———. 2005. “Measuring and Interpreting Expectations of Equity Returns.” Working Paper. Cambridge, MA: National Bureau of Economic Research.
Egan, Mark L., Alexander MacKay, and Hanbin Yang. 2022. “Recovering Investor Expectations from Demand for Index Funds.” The Review of Economic Studies 89(5): 2559-2599.
Grable, John and Ruth H. Lytton. 1999. “Financial Risk Tolerance Revisited: The Development of a Risk Assessment Instrument.” Financial Services Review 8(3).
Greenwood, Robin and Andrei Shleifer. 2014. “Expectations of Returns and Expected Returns.” Review of Financial Studies 27(3): 714-746.
Hou, Wenliang. 2020. “How Accurate Are Retirees’ Assessments of Their Retirement Risk?” Working Paper 2020-14. Chestnut Hill, MA: Center for Retirement Research at Boston College.
Jagannathan, Ravi and Narayana R Kocherlakota. 1996. “Why Should Older People Invest Less in Stocks Than Younger People?” Minneapolis, MN: Federal Reserve Bank of Minneapolis.
Kézdi, Gábor and Robert J. Willis. 2008. “Stock Market Expectations and Portfolio Choice of American Households. Preliminary and Incomplete.” Cambridge, MA: National Bureau of Economic Research.
Merton, Robert C. 1971.“Optimum Consumption and Portfolio Rules in a Continuous-Time Model.” Journal of Economic Theory 3(4): 373-413.
———. 1969. “Lifetime Portfolio Selection under Uncertainty: The Continuous-Time Case.” The Review of Economics and Statistics 51(3): 247-257.
Morningstar. 2024a. Morningstar Lifetime Allocation Indexes Aggressive. Chicago, IL.
———. 2024b. Morningstar Lifetime Allocation Indexes Conservative. Chicago, IL.
———. 2024c. Morningstar Lifetime Allocation Indexes Moderate. Chicago, IL.
———. 2015. “Construction Rules for Morningstar Asset Allocation Index Family.” Morningstar Methodology Paper. Chicago, IL.
Pástor, Ľuboš and Robert F. Stambaugh. 2012. “Are Stocks Really Less Volatile in the Long Run?” The Journal of Finance 67(2): 431-478.
Samuelson, Paul A. 1969. “Lifetime Portfolio Selection By Dynamic Stochastic Programming.” The Review of Economics and Statistics 51(3): 239-246.
University of Michigan. Health and Retirement Study, 2020. Ann Arbor, MI.
U.S. Board of Governors of the Federal Reserve System. Survey of Consumer Finances, 2022. Washington, DC.
Appendix
Endnotes
- Aubry and Yin (2025). ↩︎
- See a similar discussion in Boyd and Yin (2017)
about the increasing uncertainty in asset values in the
context of public sector pension funds, which are also
long-term investors. Also see Bodie (1995) and Pástor
and Stambaugh (2012) for more in-depth analyses on
the risk of stocks in the long run. ↩︎ - This result also requires that the financial market is frictionless, stock returns are independently and identically distributed, and the individual’s preference takes a certain functional form. ↩︎
- See Merton (1971) and Bodie, Merton, and Samuelson (1992). ↩︎
- See Jagannathan and Kocherlakota (1996). ↩︎
- See Dominitz and Manski (2007); Kézdi and Willis (2008); and Beutel and Weber (2022). ↩︎
- Egan, MacKay, and Yang (2022). ↩︎
- See Kézdi and Willis (2008) and Hou (2020). ↩︎
- Dominitz and Manski (2005), Amromin and Sharpe (2012), and Greenwood and Shleifer (2014). ↩︎
- See Grable and Lytton (1999). ↩︎
- Each survey also provides one additional risk option: “below average risk” in the Investor Survey and “above average risk” in the SCF. Interestingly, the data from each survey suggest that about one-quarter of retirement investors fall into these more subtle categories surrounding average risk-taking. The most one can say from these data is that a quarter of retirees see themselves as not quite average risk takers, but also not at the extremes. ↩︎
- This finding is true even for those retirement investors who are working with or have worked with an advisor, among whom the mean and standard deviation of stock allocations are 39 percent and 25 percent, respectively. ↩︎
- Asset allocations of these glide paths are obtained from Morningstar (2024a, 2024b, 2024c). See Morningstar (2015) for an overview of the underlying methodology. Greater risk tolerance levels and less risky labor income result in more aggressive glide paths (higher stock allocation at all given ages). While the specific shapes of the glide paths are affected by the TDF providers’ choice of assumptions, glide paths of TDFs targeting a broad market can still serve as a useful benchmark. ↩︎
- The distributions of desired stock allocations are calculated for four 10-year windows around retirement, with the two on the left for near-retirees (aligned using expected years to retirement) and the two on the right for retirees (aligned using reported years since retirement). ↩︎
- The HRS data are limited to households with heads ages 50-78 who own $100,000+ in investable assets, are not covered by DB plans, and provide sufficient information about their perceived risk and return of stocks. To match the age range in the HRS, respondents younger than 50 are dropped from the Investor Survey. ↩︎
- To keep each regression parsimonious without compromising completeness, we test multiple potential measures related to each factor and keep the one with the most explanatory power. Also, to make the results comparable, variables in one survey may be modified to approximately match the form of their conceptual counterparts in the other survey. (See Aubry and Yin (2025) for details on the variables used.) ↩︎
- Interestingly, some factors and household characteristics, such as homeownership and marital status,
show statistically significant impacts on actual stock
allocations but not on desired allocations. However,
their contributions to the share of variation explained
are quite small compared to wealth and subjective
factors. ↩︎


Aubry, Jean-Pierre and Yimeng Yin. 2025. "Why Do Desired Stock Allocations Differ from Actual Holdings?" Issue in Brief 25-17. Chestnut Hill, MA: Center for Retirement Research at Boston College.


