
Medicare Finances: A 2023 Update

The brief’s key findings are:
- Headlines from the 2023 Medicare Trustees’ Report focused on the program’s looming financial concerns.
- But the Report itself did not contain bad news – in fact, it showed modest improvements over the prior year.
- And, more strikingly, the outlook is much better than it was a decade ago, even under assumptions that policymakers curb some cost controls.
- Nevertheless, Medicare still faces significant challenges:
- its costs are high because it operates within the very expensive U.S. health care system; and
- at the same time, it has serious gaps in insurance protection.
Introduction
The headlines from the 2023 Medicare Trustees Report were that the Hospital Insurance (HI) program faces a long-term deficit and will deplete its trust fund reserves in 2031 and that the rest of the Medicare program will require increasing amounts of general revenues. While true, the outlook for program costs is considerably more favorable than it was a decade and a half ago, and that picture persists even under an alternative scenario in the Trustees Report, which assumes that Congress phases out some of the cost controls in current law. Nevertheless, costs remain high. This brief summarizes the current state of Medicare’s finances.
The discussion proceeds as follows. The first section provides an overview of the Medicare program. The second section describes the 2023 Trustees Report projections that use current-law assumptions. The third compares the current-law projections to an alternative scenario prepared by Medicare’s Office of the Actuary. The fourth explores possible reasons for Medicare’s high costs. The final section concludes that while Medicare’s finances – even under the alternative assumptions – have improved considerably, the costs remain high. The reason is not the generosity of the program – in fact, it has serious benefit gaps – but rather that Medicare operates in a country with extraordinarily high health care costs.
An Overview of Medicare
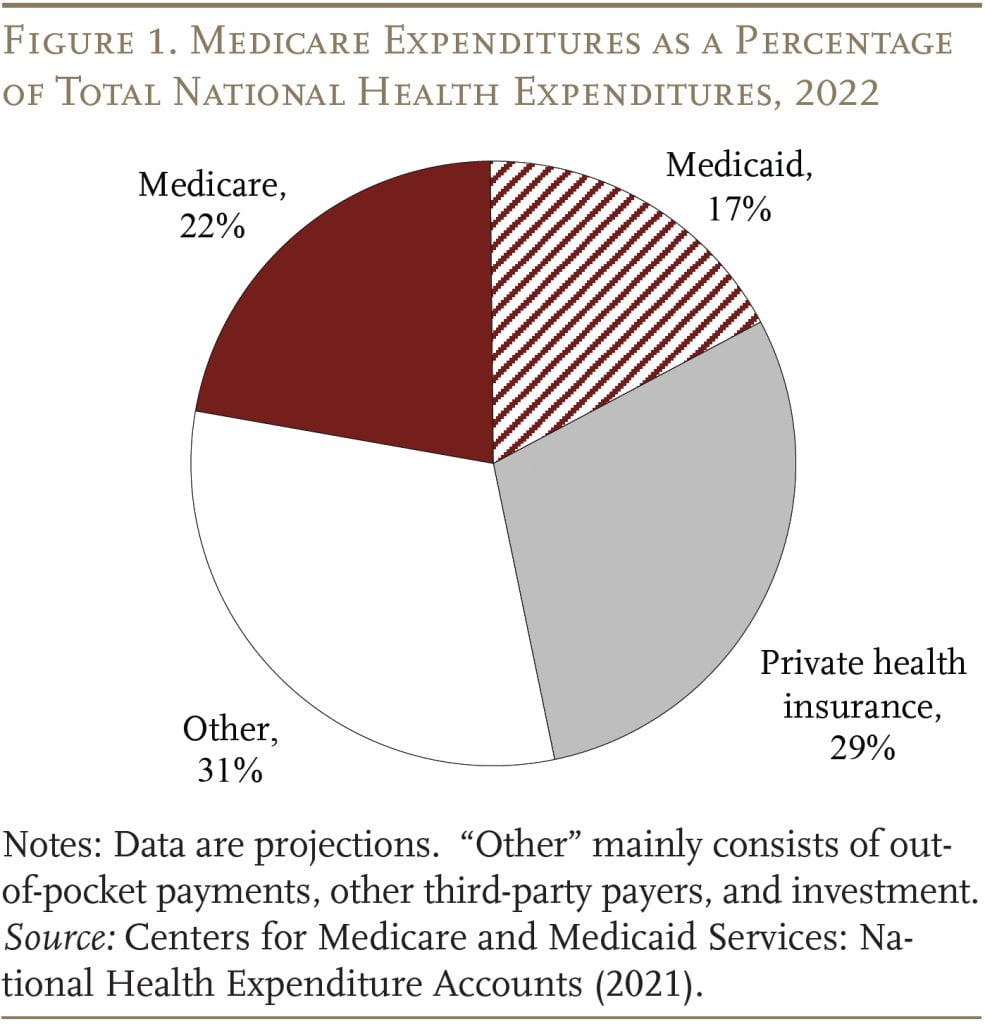
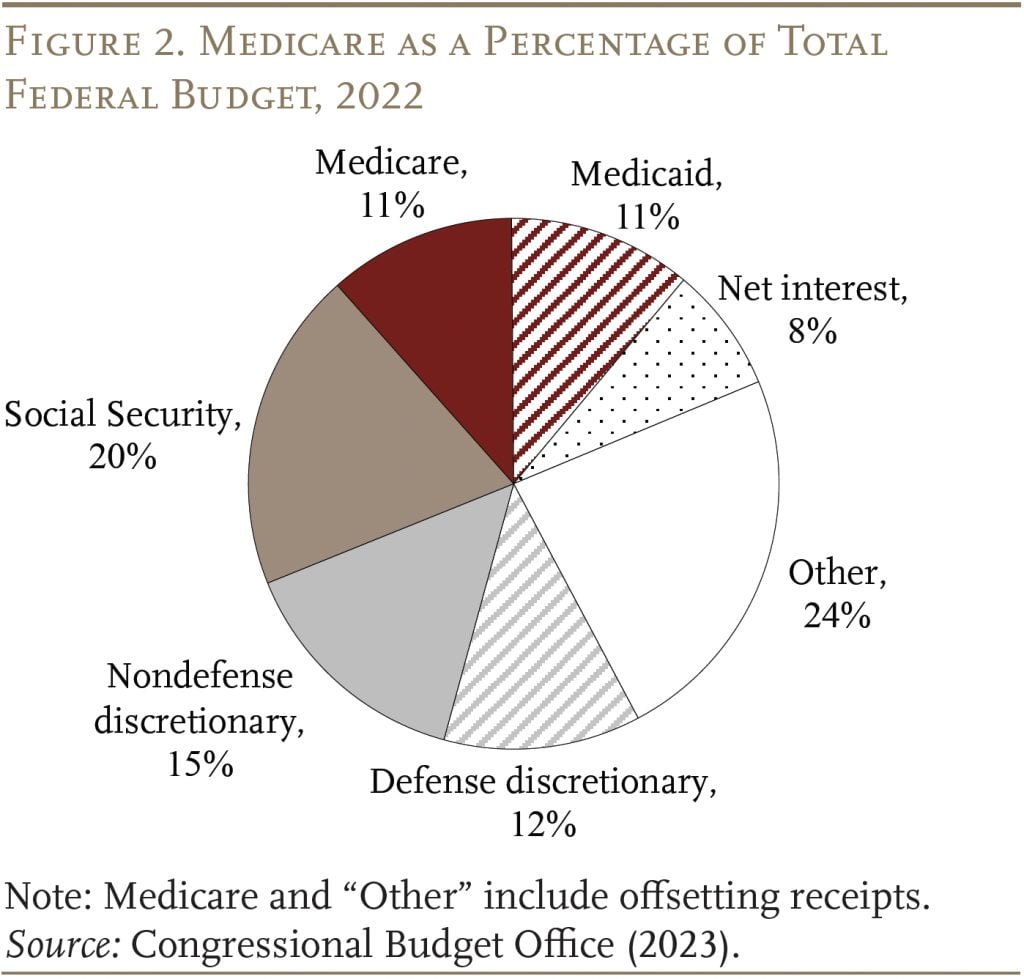
Medicare is the largest public health program in the United States. It covers virtually all persons ages 65 and older and people who receive federal disability insurance benefits. As shown in Figures 1 and 2, the program accounts for 22 percent of national health care spending and 11 percent of the federal budget.
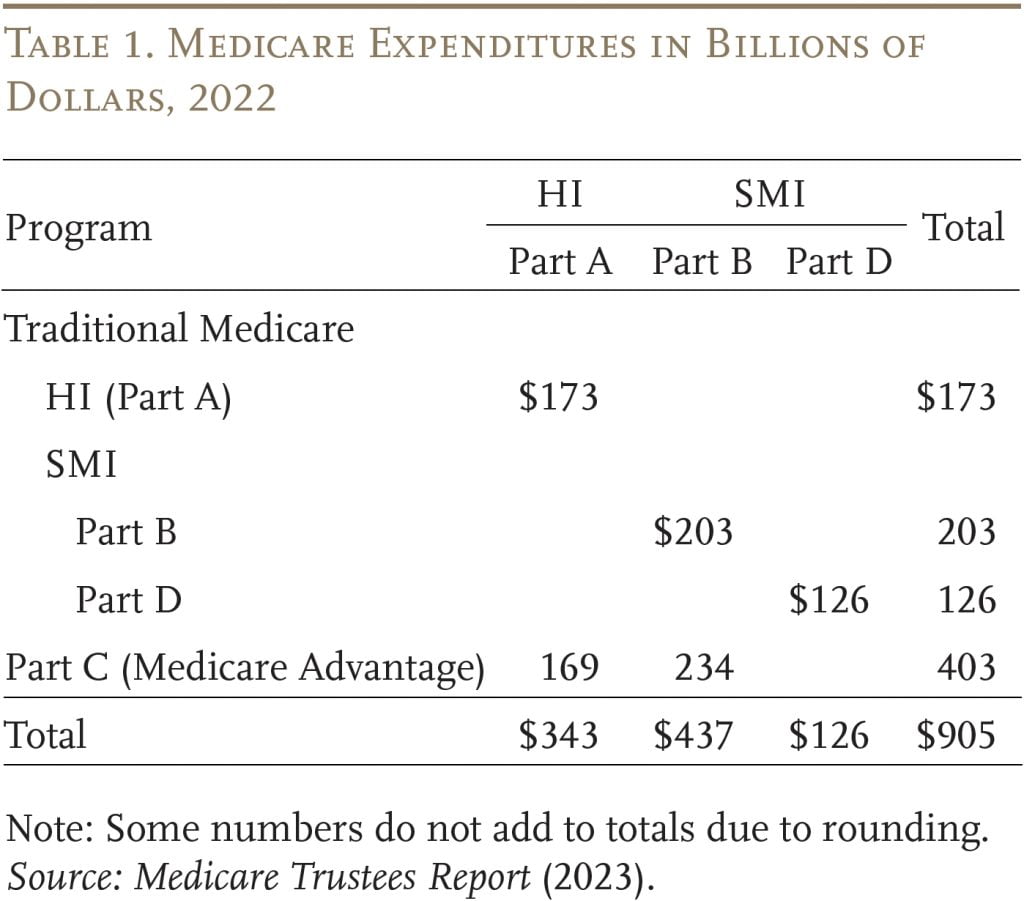
Traditional Medicare is composed of two programs (see Table 1). The first – Part A, Hospital Insurance (HI) – covers inpatient hospital services, skilled nursing facilities, home health care, and hospice care. The second – Supplementary Medical Insurance (SMI) – consists of two separate accounts: Part B, which covers physician and outpatient hospital services, and Part D, which was enacted in 2003 and covers prescription drugs. The arrangements are slightly more complicated because Medicare also includes Part C – the Medicare Advantage plan option, which makes payments to private insurance plans that provide both Part A and Part B services.1The share of Medicare beneficiaries choosing Advantage plans has risen rapidly in recent years; it reached 46 percent in 2022, up from 13 percent in 2004. The Trustees project that the overall participation rate for these plans will keep rising – to about 56 percent in 2032 and thereafter.
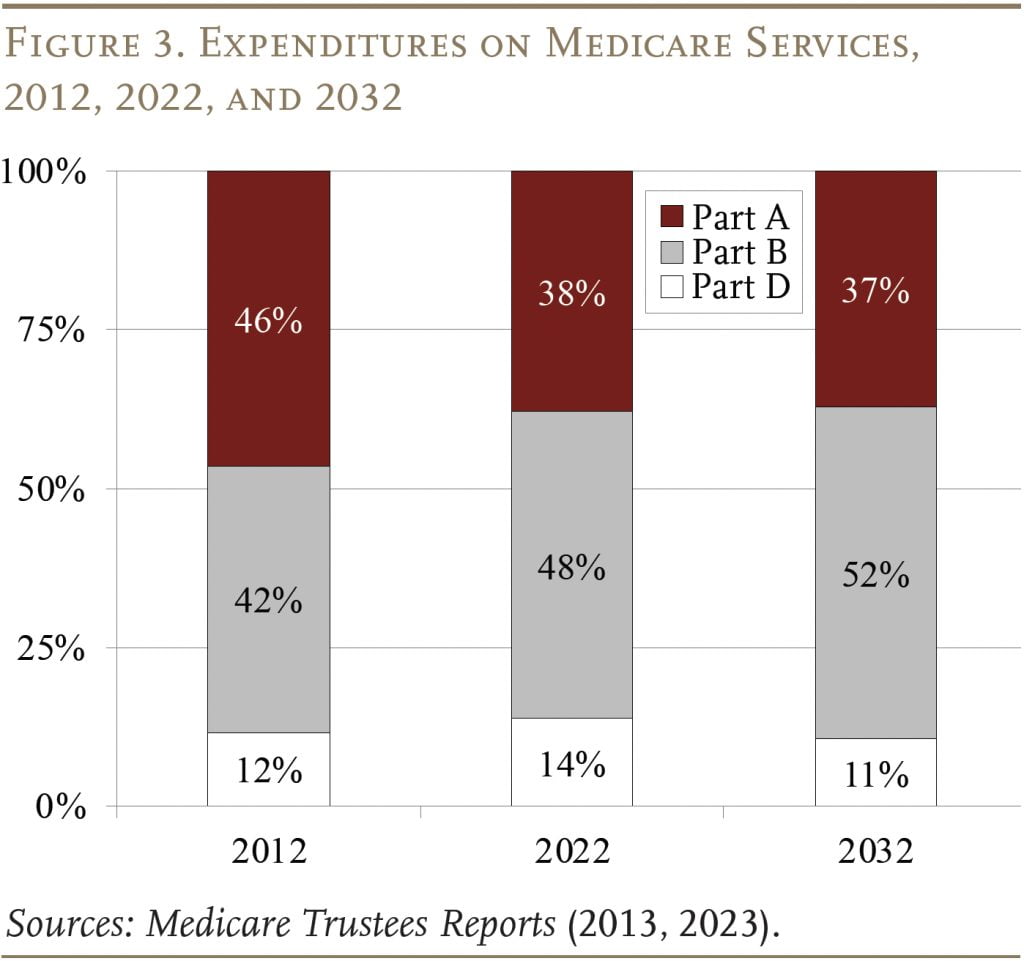
The pattern of Medicare expenditures has shifted over time (see Figure 3). In 2012, Part A was the largest component, accounting for 46 percent of total expenditures. By 2022, Part A had declined to 38 percent, reflecting a shift from inpatient to outpatient services, and spending on Part B benefits had grown to 48 percent. This shift is expected to continue in the future, so that Part B will account for more than half of total spending in 2031. Spending on Part D prescription drug benefits has been a roughly constant share of total spending over time.
Each Medicare program has its own trust fund and its own source of revenues. Part A (HI) is paid for primarily by a 2.9-percent payroll tax, shared equally by employers and employees. In addition, high-income workers pay a 0.9-percent tax on their earnings above a threshold of $200,000 for singles and $250,000 for married couples. Since these thresholds are not indexed for wage growth or inflation, an increasing proportion of workers and their earnings will become subject to the higher HI tax rate.2By the end of the long-range projection period, an estimated 80 percent of workers would be subject to this additional tax. Thus, HI payroll tax revenues will increase steadily as a percentage of taxable payroll. Overall, payroll taxes accounted for 89 percent of Part A revenue in 2022. Most of the remaining revenue comes from a portion of the federal income taxes that Social Security recipients pay on their benefits.
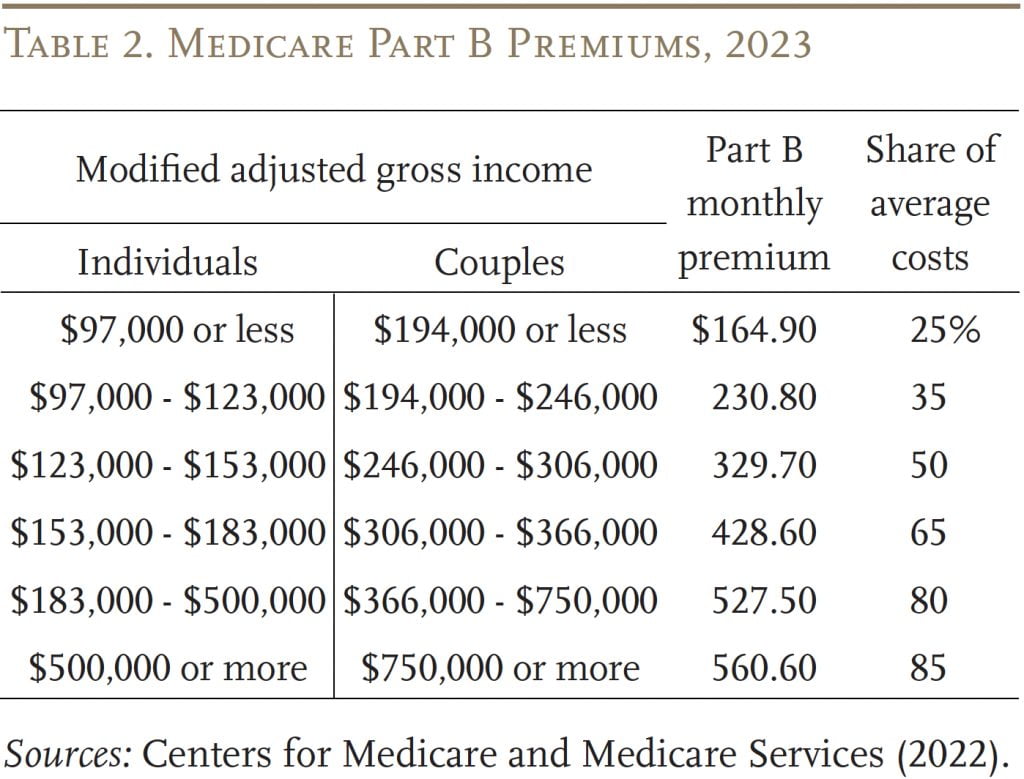
Part B is financed by a combination of participant premiums and general revenues. Most beneficiaries pay the standard premium amount, which is set by law to equal 25 percent of the estimated average per-person cost; the remaining 75 percent is covered by general revenues. Beneficiaries with annual incomes over $97,000 ($194,000 per couple) pay a higher, income-related premium, reflecting a larger share of Part B spending, ranging from 35 percent to 85 percent of the average per-person cost (see Table 2).
Part D, which covers outpatient prescription drugs, is financed primarily by general revenues (74 percent) and beneficiary premiums (14 percent), with an additional 11 percent coming from state payments for beneficiaries enrolled in both Medicare and Medicaid. Higher-income enrollees pay a larger share of the cost of Part D coverage, as they do for Part B.
The Medicare Trustees issue an annual report projecting the program’s finances under current law. In addition, the actuaries prepare an alternative scenario that limits the extent to which Medicare payments to hospitals and physicians fall below those made by private insurers.
Medicare Finances under Current Law
In the wake of the Affordable Care Act of 2010, the Medicare current-law projections have assumed a substantial reduction in the growth rate of per-capita health expenditures relative to historical experience. While such projections for government programs sometimes prove optimistic, Medicare has actually experienced slower spending growth in recent years.
The Outlook for HI – Part A
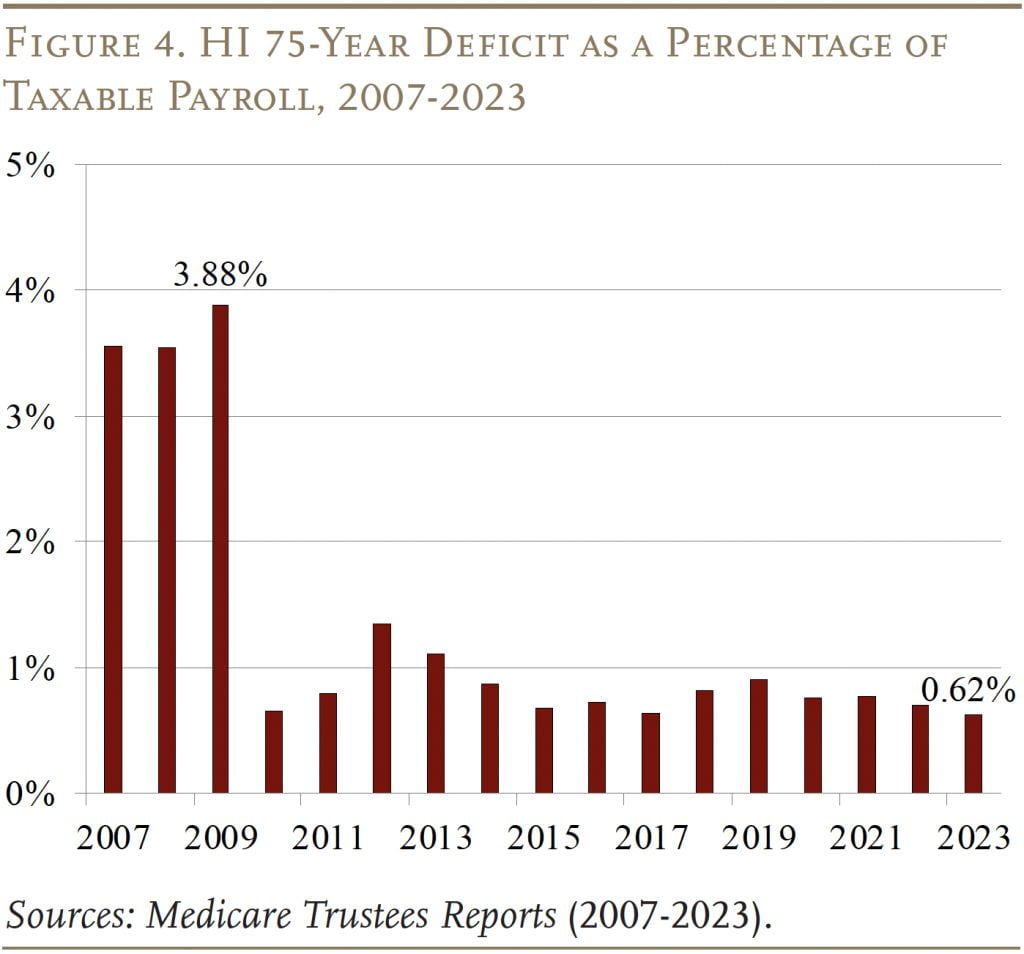
In terms of the HI program – the component of Medicare financed by the payroll tax – the lower projected costs have led to substantially smaller 75-year deficits (see Figure 4). The 2023 Medicare HI deficit of 0.62 percent of taxable payrolls is actually at the low end of the diminished deficits that emerged in the wake of the Affordable Care Act (ACA).
For the HI trust fund to remain solvent throughout the 75-year projection period, the 2.90-percent payroll tax would need to be immediately increased by 0.62 percentage points. Social Security, which represents a competing demand on payroll tax revenues, would require an additional 3.44 percentage points to achieve 75-year solvency. If the gap were closed by cutting benefits, HI would require a 13-percent cut; Social Security a 21-percent cut.
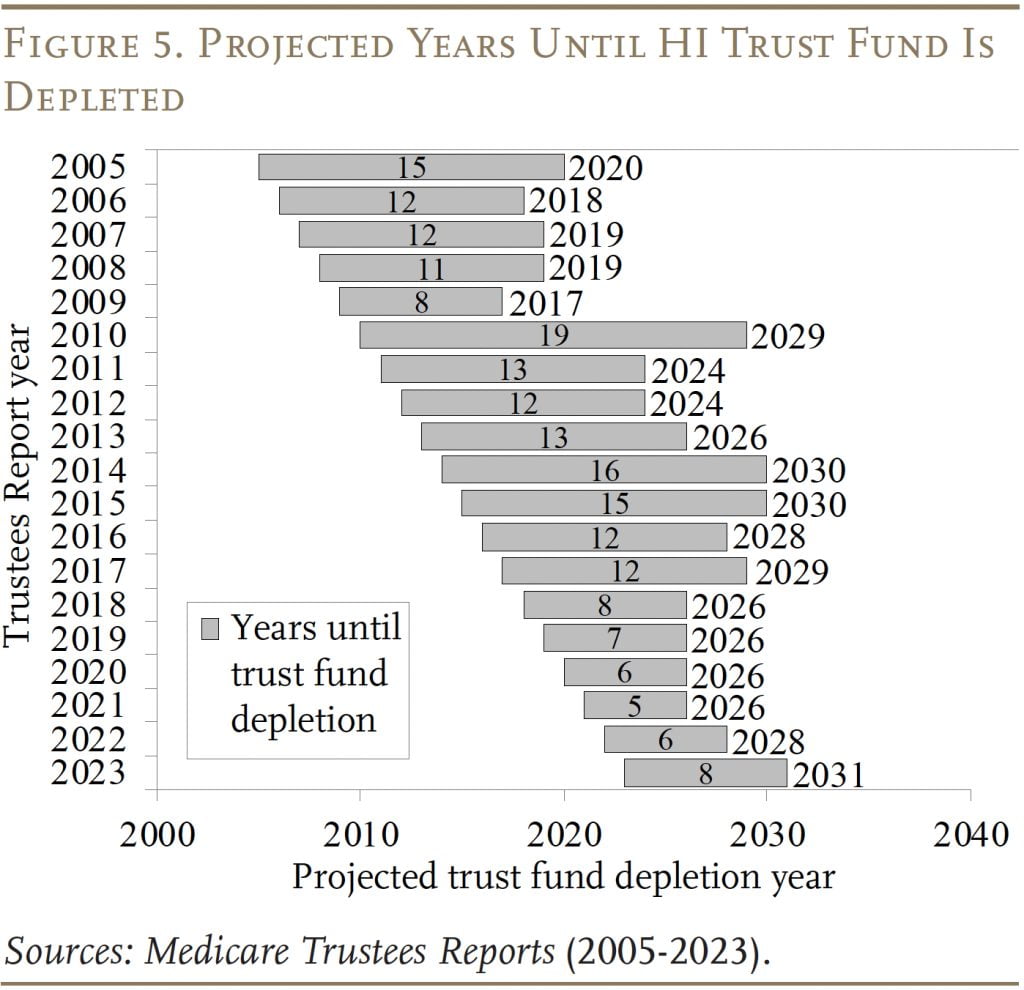
The HI trust fund is projected to deplete its reserves in 2031. In that year, revenues would be sufficient to cover only 89 percent of program costs, so benefits would be reduced immediately by 11 percent. While the projected depletion is an action-forcing event for the Congress, the outlook has improved since last year’s report (see Figure 5 ). This improvement is due, in part, to increased revenues due to higher employment and higher wages and, in part, to lower expenditures in the wake of COVID.
The Outlook for SMI – Parts B and D
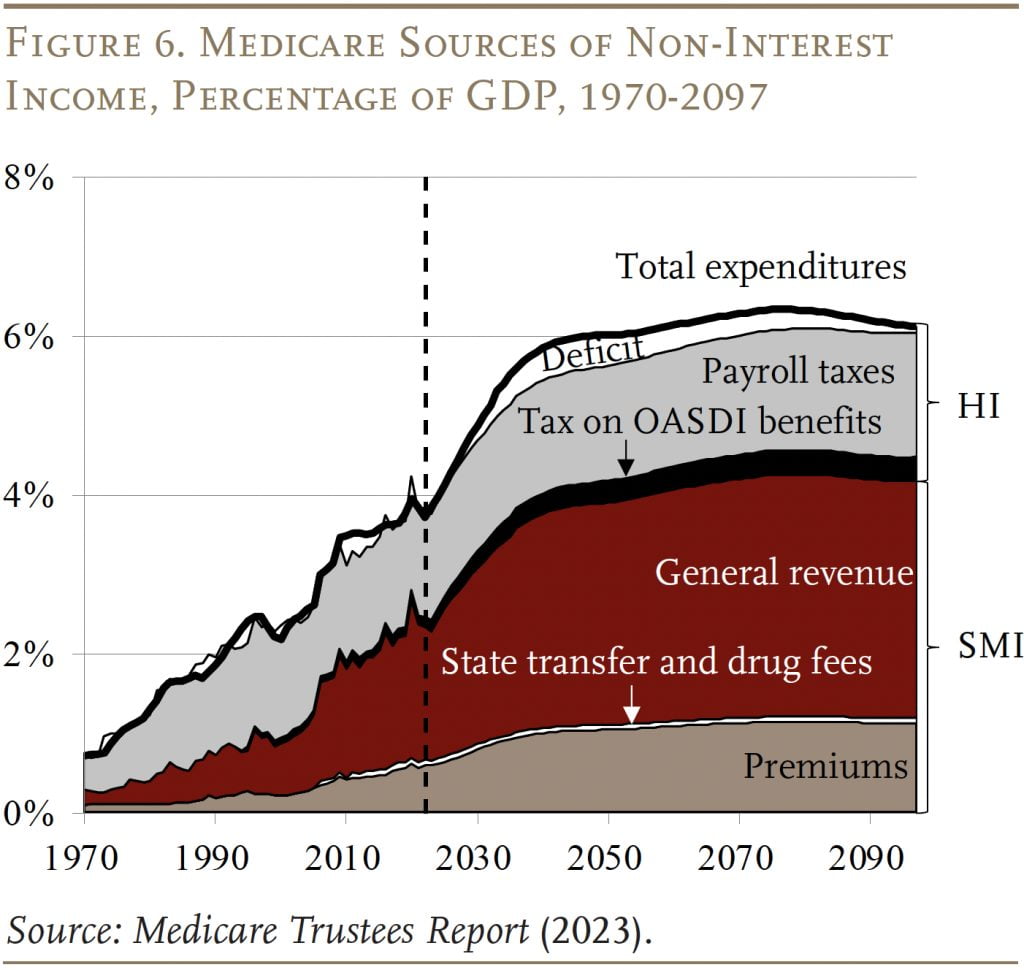
Part B, which covers physician and outpatient hospital services, and Part D, which covers prescription drugs, are both adequately financed for the indefinite future, because the law provides for general revenues and participant premiums to meet the next year’s expected costs. Of course, an increasing claim on general revenues puts pressure on the federal budget and rising SMI premiums place a growing burden on beneficiaries. Figure 6 shows the increasing contribution of general revenues and premiums in the financing of the Medicare program to covering the rising expenditures under Parts B and D. These expenditures are also somewhat lower than in the previous report due to cost-control measures in the Inflation Reduction Act and an anticipated drop in health care service needs after the peak of the pandemic.
Projections under Alternative Assumptions
The Trustees’ main projections are based on current law and, therefore, include the impact of cost-control provisions in the ACA and subsequent legislation.3The ACA, passed in 2010, contained roughly 165 provisions aimed at reducing costs, increasing revenues, eliminating fraud and waste, and developing research and technological enhancements. Subsequently, the Medicare Access and CHIP Reauthorization Act of 2015 (MACRA) revised the system for paying physicians. To the extent that these provisions end up producing inadequate reimbursement rates for Medicare providers, hospitals and doctors could either stop serving Medicare patients or shift some of the costs to non-Medicare patients. In response, Congress may find it necessary to curtail the payment reductions. To account for the uncertain future of the cost control measures, the Medicare actuaries also produce alternative projections.4The actuaries note that the use of an alternative scenario for analysis should not be construed as an endorsement by the Trustees, CMS, or the actuaries themselves.
The major differences between the current-law and alternative projections relate to updating the amounts to be paid to hospitals and physicians.
Productivity Adjustments for Hospital Services. The hospital services covered by Medicare require annual payment increases. To create strong incentives for health care providers to improve efficiency, the ACA reduced the annual increases by the percentage increase in economy-wide productivity. The problem is that health services are very labor intensive, so productivity gains in this sector are likely to be much smaller than those in other parts of the economy and subtracting economy-wide productivity will lead to inadequate increases. As a result, under current law, Medicare payment rates for inpatient hospital services are projected to decline from about 60 percent of private insurance payment rates today to just 40 percent by 2097. The alternative scenario assumes that, between 2028 and 2042, the economy-wide productivity adjustment will gradually phase down until annual Medicare price updates equal those assumed for private plans.
Physician Payments. Physicians also receive annual Medicare payment updates and, once again, cost-saving restrictions have sharply limited the magnitude of the updates. As a result, under current law, Medicare physician payments are projected to fall from about 63 percent of private health insurance payment rates today to about 24 percent in 2097. The alternative scenario for SMI-Part B assumes that the increases in physician payments will gradually transition, over the period 2028-2042, from current law to the growth in the Medicare Expenditure Index. In addition, bonuses for qualifying physicians and payments for physicians in a merit-based incentive pay system, which are both set to expire in the next year or two, are assumed to continue indefinitely.
With the relaxation of cost-saving provisions in current law, expenditures under Parts A and B would increase noticeably as a percentage of GDP. (Part D costs were not affected by legislated cost controls.) By 2090, the total cost of Medicare is about 2 percent of GDP higher under the alternative than under the current-law provisions (see Table 3).
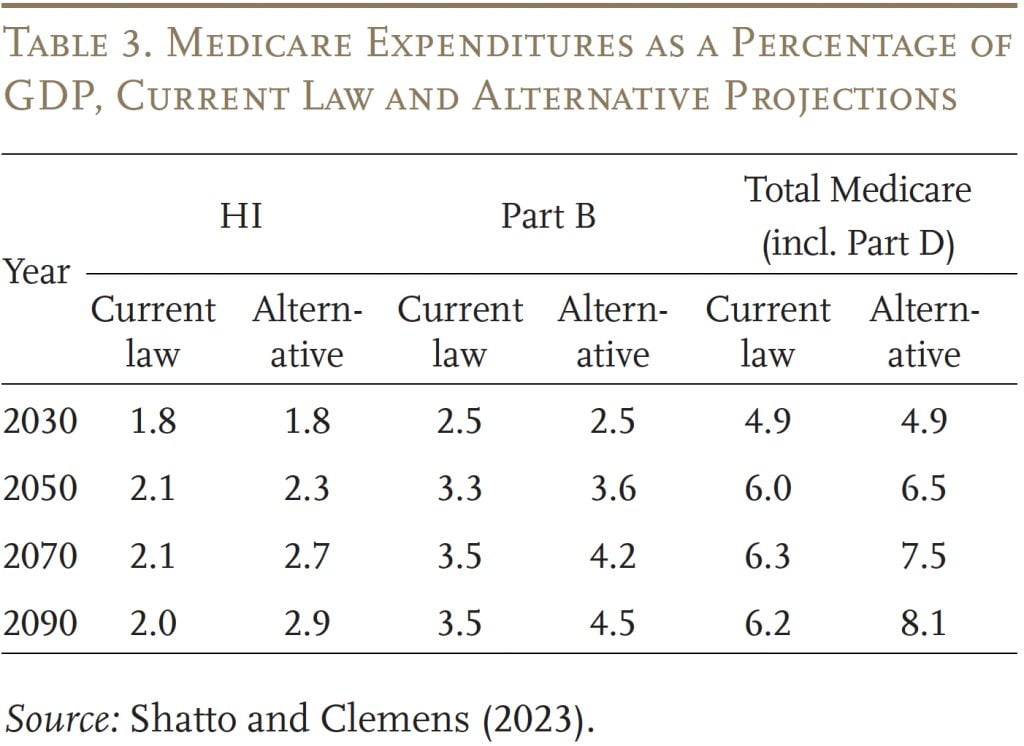
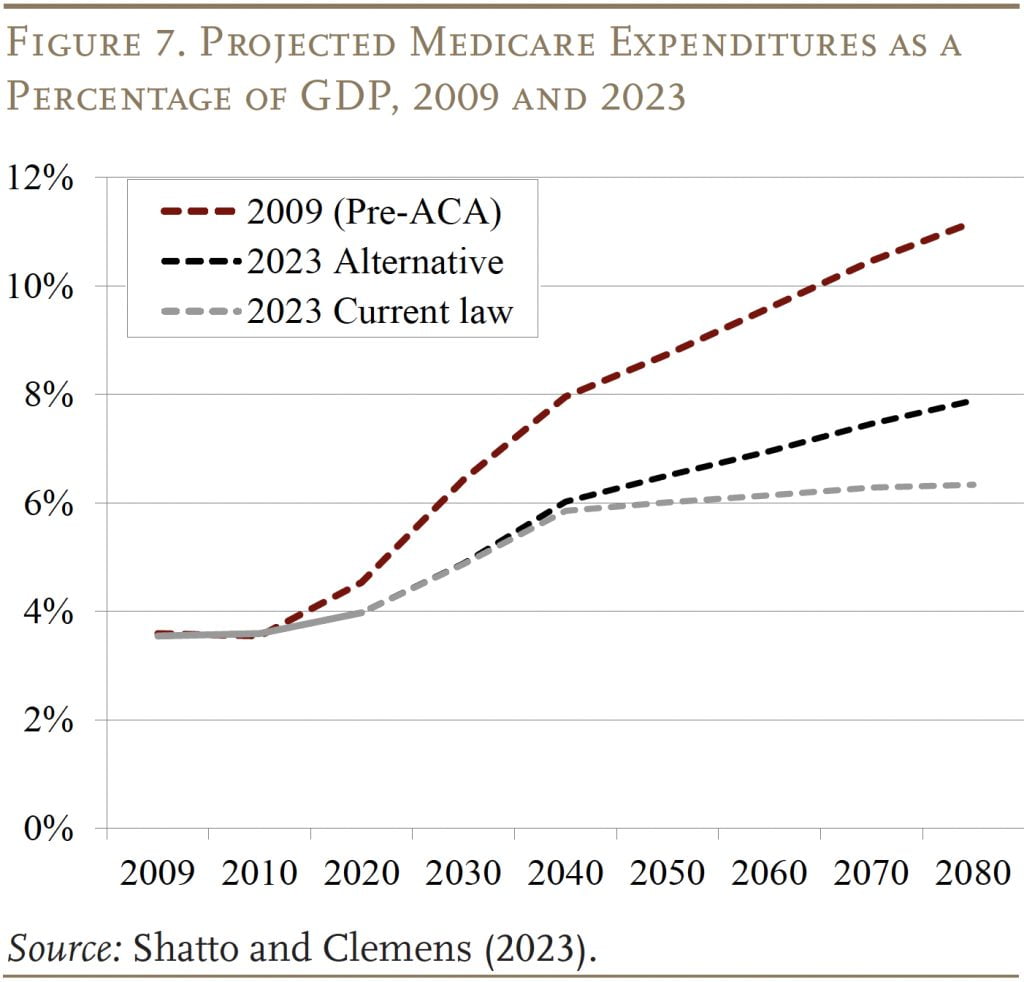
When assessing the status of Medicare as a percentage of GDP, one further figure may be helpful. Yes, the projections under the alternative assumptions are higher than those based on current law, but even these higher expenditure numbers are way below pre- ACA projections (see Figure 7).
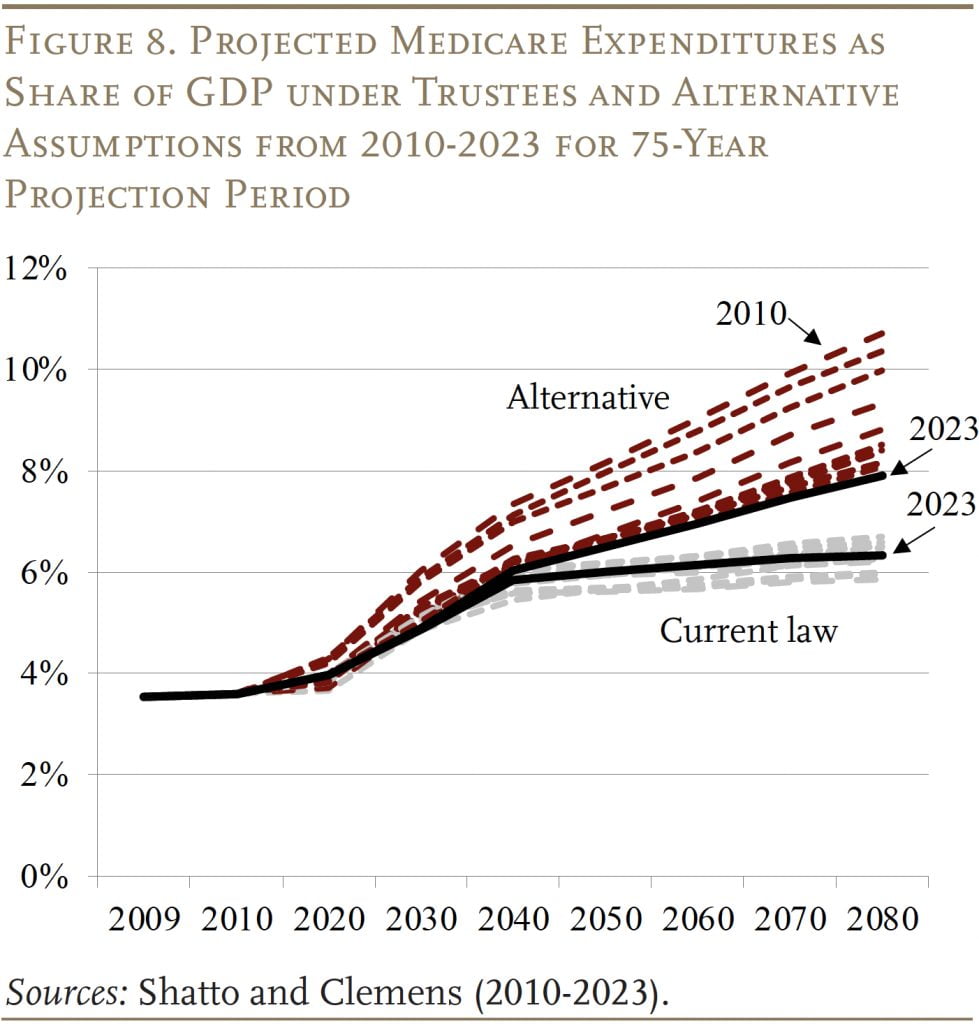
With 14 years of Trustees’ and alternative projections for comparison, an interesting question is whether they are converging or diverging over time. As shown in Figure 8, the current-law projec tions have remained within a relatively narrow band, with the 2023 projections roughly in the middle. In contrast, the alternative projections have declined noticeably, with 2023 at the low end. Thus, the two sets of estimates have converged substantially, and the expenditure gap in the 2090s appears to have stabilized at slightly less than 2 percent of GDP.
Possible Reasons for Medicare’s High Cost
While the 2023 Trustees Report did not produce any alarming news on the Medicare front, Medicare costs are high and growing – placing a burden on the government budget and on beneficiaries. The question is why?
Discussions about Medicare are often framed as if the program were excessively generous, implying that the solution is to cut back. In fact, Medicare coverage is less comprehensive than most private sector plans. For example, Medicare provides only limited mental health benefits and does not place an upper-bound on cost-sharing responsibilities for hospital stays, skilled nursing facility care, or physician costs. As a result, people with long and complicated illnesses could incur tens of thousands of dollars in out-of-pocket expenses. In addition, participants are not covered for dental services, eye glasses, and hearing aids. Thus, the challenge is not only to control the costs of the benefits currently provided by Medicare, but also to create some room for improvement in the benefit package.
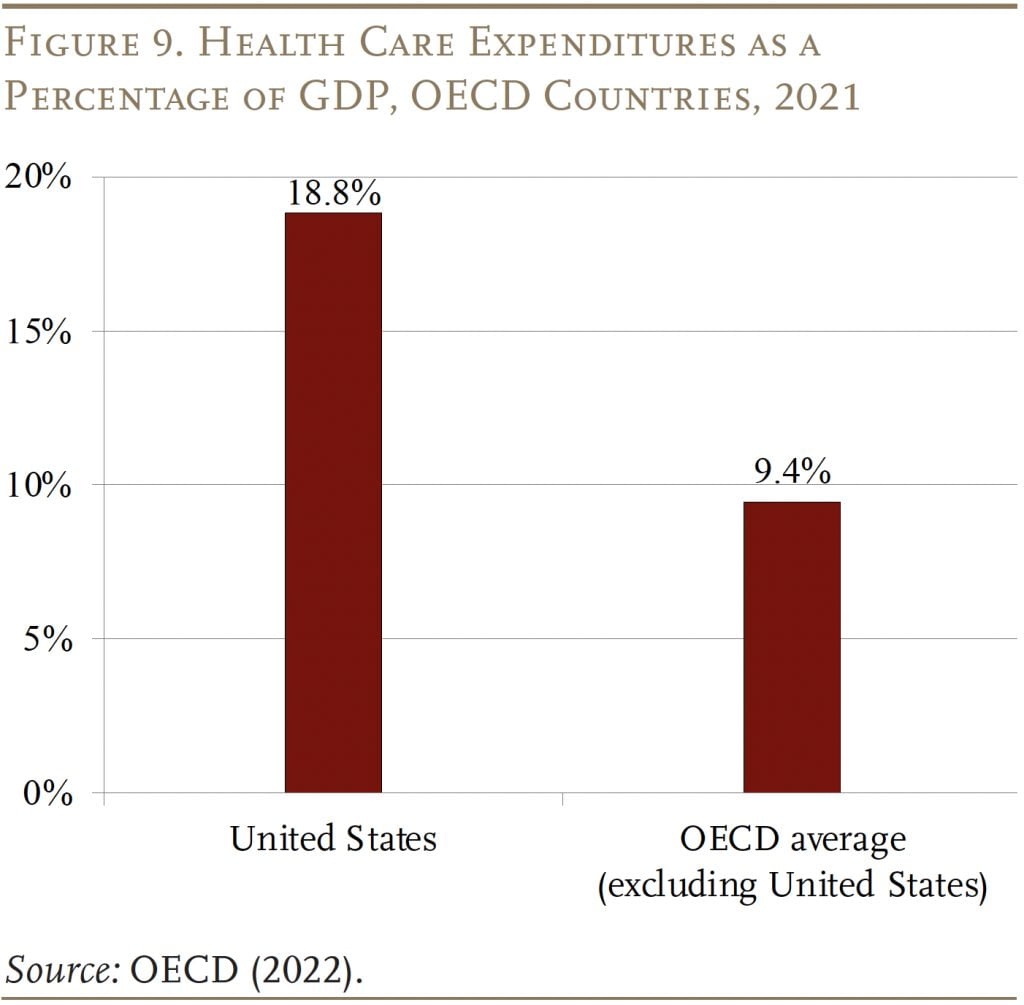
A better explanation for why Medicare’s costs are so high is that it operates in an expensive environment. U.S. health care costs as a percentage of GDP are the highest in the developed world and twice as high as the average of all the other countries in the Organisation for Economic Co-operation and Development (OECD) (see Figure 9). Differences in U.S. health costs are driven by relatively high salaries for doctors, high drug prices, high administrative costs, and greater usage of certain procedures.5For example, see Papanicolas, Woskie, and Jha (2018). These broader market pressures make Medicare an expensive program.
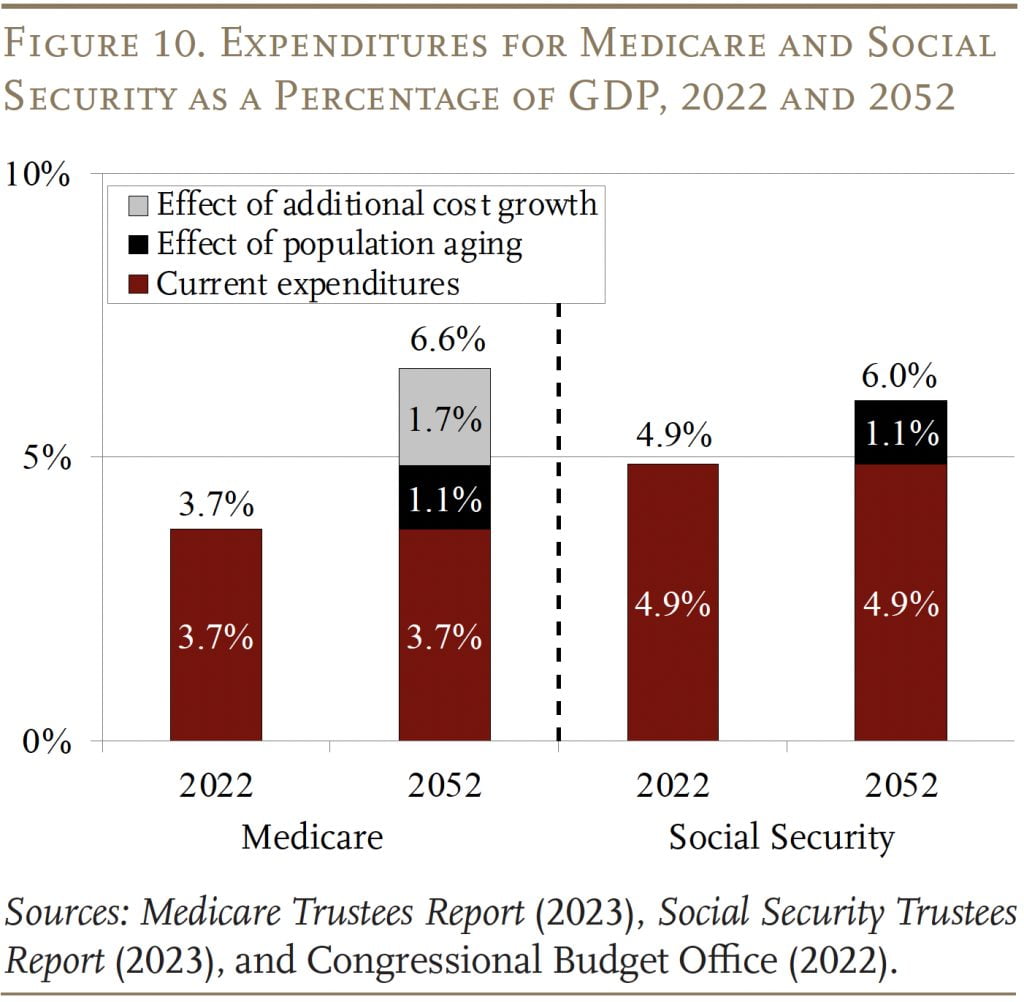
Moreover, these same pressures that produce high current costs also help explain much of Medicare’s future growth. In contrast to Social Security, where population aging can explain all the growth in expenditures over the next 30 years, an aging population explains much less than half of projected future growth in Medicare (see Figure 10). The rest comes from the costs for hospital and physician services rising faster than GDP. The bottom line is that the only way to control Medicare costs is to get national health care spending under control.
Conclusion
The 2023 Medicare Trustees Report contained no bad news. In fact, in Part A, the depletion of the HI trust fund was pushed out three years and the HI deficit was at the low end of post-ACA numbers, while expenditures for Part B and Part D were actually slightly below those in the 2022 report. That said, Medicare does face significant financing challenges: it operates in a country with extraordinarily high health care costs and it has some serious gaps in protection.
References
Centers for Medicare and Medicaid Services. 2005- 2023. Annual Report of the Boards of Trustees of the Federal Hospital Insurance and Federal Supplementary Medical Insurance Trust Funds. Washington, DC: U.S. Department of Health and Human Services.
Centers for Medicare and Medicaid Services. 2022. “2023 Medicare Parts A & B Premiums and Deductibles 2023 Medicare Part D Income-Related Monthly Adjustment Amounts.” Fact Sheet. Washington, DC: U.S. Department of Health and Human Services.
Centers for Medicare and Medicaid Services. 2021. National Health Expenditure Accounts. Washington, DC: U.S. Department of Health and Human Services.
Congressional Budget Office. 2023. “The Budget and Economic Outlook: 2023 to 2033.” Washington, DC.
Congressional Budget Office. 2022. “The 2022 Long- Term Budget Outlook.” Washington, DC.
Papanicolas, Irene, Liana R. Woskie, and Ashish K. Jha. 2018. “Health Care Spending in the United States and Other High-Income Countries.” Journal of the American Medical Association 319(10): 1024- 1039.
Organisation for Economic Co-operation and Development. 2022. “OECD Health Statistics.” Paris, France. Available at: https://www.oecd.org/els/ health-systems/health-data.htm
Shatto, John D. and M. Kent Clemens. 2010-2023. “Projected Medicare Expenditures under an Illustrative Scenario with Alternative Payment Updates to Medicare Providers.” Washington, DC: U.S. Department of Health and Human Services.
U.S. Social Security Administration. 2023. The Annual Reports of the Board of Trustees of the Federal Old- Age and Survivors Insurance and Federal Disability Insurance Trust Funds. Washington, DC: U.S. Government Printing Office.
Endnotes
- 1The share of Medicare beneficiaries choosing Advantage plans has risen rapidly in recent years; it reached 46 percent in 2022, up from 13 percent in 2004. The Trustees project that the overall participation rate for these plans will keep rising – to about 56 percent in 2032 and thereafter.
- 2By the end of the long-range projection period, an estimated 80 percent of workers would be subject to this additional tax. Thus, HI payroll tax revenues will increase steadily as a percentage of taxable payroll.
- 3The ACA, passed in 2010, contained roughly 165 provisions aimed at reducing costs, increasing revenues, eliminating fraud and waste, and developing research and technological enhancements. Subsequently, the Medicare Access and CHIP Reauthorization Act of 2015 (MACRA) revised the system for paying physicians.
- 4The actuaries note that the use of an alternative scenario for analysis should not be construed as an endorsement by the Trustees, CMS, or the actuaries themselves.
- 5For example, see Papanicolas, Woskie, and Jha (2018).


Munnell, Alicia H. and Michael Wicklein. 2023. "Medicare Finances: A 2023 Update" Issue in Brief 23-11. Chestnut Hill, MA: Center for Retirement Research at Boston College.