
Rising Social Security Costs: It’s Not Just the Baby Boom

Alicia H. Munnell is a columnist for MarketWatch and senior advisor of the Center for Retirement Research at Boston College.
The baby boom is beginning to retire and Social Security costs are rising. Commentators often attribute the cost of Social Security to the retirement of the baby boom. Others go so far as to suggest that the baby boom is “a pig in a python,” a large cohort just passing through and once the last member dies life will return to normal. In fact, the baby boom has little to do with the ultimate cost of Social Security. Rather those costs reflect the long-term aging of the population due to a decline in births and an increase in life expectancy. The aging is not going to reverse itself.
The U.S. population has been growing older since the dawn of the republic. Over the 200 years between 1880 and 2080, the shape of the U.S. population is changing from a pyramid – with the base representing the younger population – to almost a rectangle as the relative number of old people increases and the relative number of children declines. Note that neither of the dates in question has anything to do with the baby boom; 1880 predates the first boomer by more than six decades, and by 2080 virtually all the boomers will have died. (The youngest boomers, born in 1964, would be 116 in 2080.)
For a host of reasons – reduced economic need for children, higher likelihood of child survival to maturity, and increased control by women over reproduction – fertility rates have been falling for much of the past two centuries (see Figure 1). This decline – together with increased longevity –explains the low worker/retiree ratio and high Social Security costs in 2080. The baby boom plays no role in terms of ultimate costs.
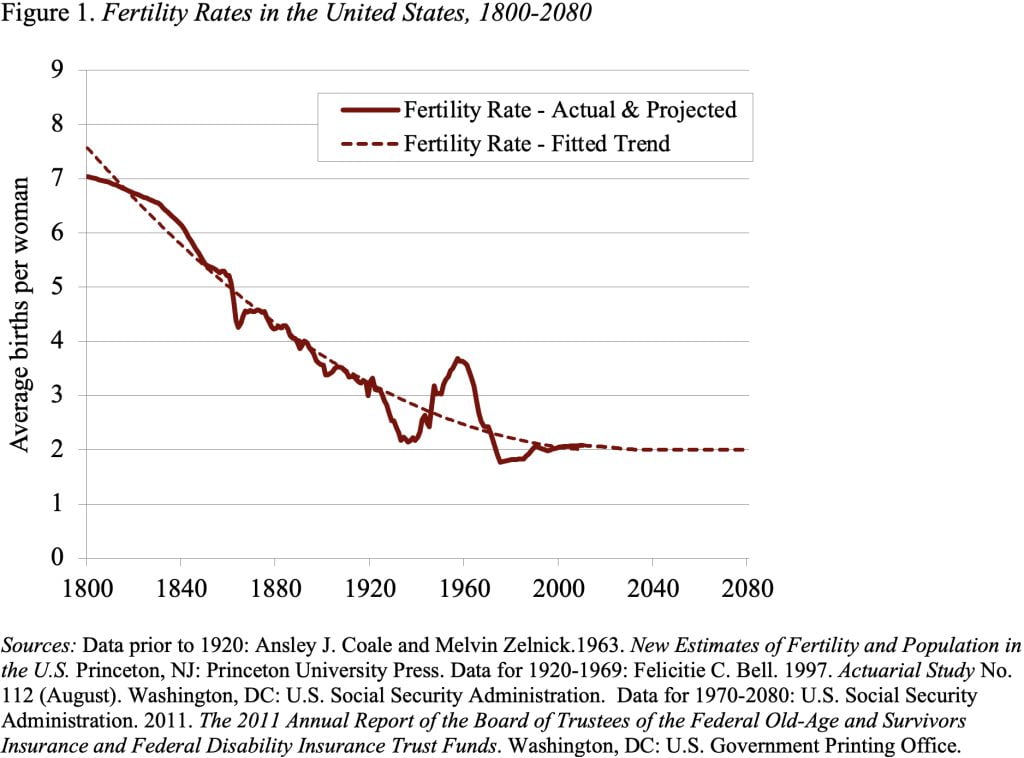
The bust-boom-bust pattern shown in the fertility chart does explain the unprecedented speed at which the population will age over the next decade. Essentially, the fertility bust of the 1920s and 1930s – primarily due to economic pressures – produced a “demographic holiday” during the 1990s. The over-65 population grew very slowly and the non-elderly population was swelled by the ranks of the post-war baby boom born between 1946 and 1964. In fact, the percent of the population aged 65 and over remained virtually flat between 1990 and 2000, a very unusual occurrence (see Figure 2).
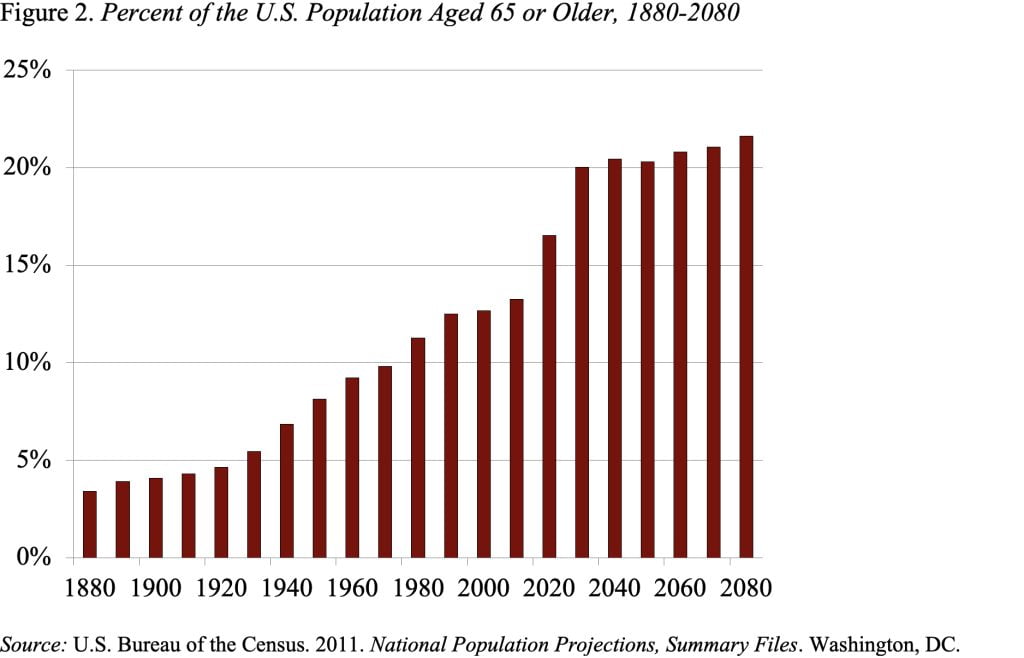
After 2000, the story changed. The first boomer turned 65 in 2011, and hordes of boomers will follow. Given that fertility rates fell back to trend after the boomers, older Americans as a percent of the population will climb dramatically over the next 20 years. After that, the percent 65 and over stabilizes and will remain stable as long as fertility rates stay at current levels. Social Security costs will also basically stabilize, subject to some upward drift due to increased longevity.
In short, the story is not about “a pig in a python,” but about a long-term decline in fertility and a bust-boom-bust pattern that explains the variation in the speed at which we reach our destination.