
Social Security Benefits and Costs Slightly Below International Average

Alicia H. Munnell is a columnist for MarketWatch and senior advisor of the Center for Retirement Research at Boston College.
It might be nice to reduce the large share of benefits going to high earners who retire later and live long lives.
To read about our federal finances, one would think we had been overtaken by forces beyond our control: extremely expensive healthcare programs, ever-growing interest payments on our debt, and runaway Social Security benefits.
Since retirement is my game, let’s assess the reasonableness of our Social Security benefits. My assumption has always been that on average they were reasonable, but a reality check can’t hurt. The discussion focuses on benefits scheduled under current law, and does not address the impending cut in benefits once the trust funds are exhausted in the early 2030s.
While the reality check shows no evidence of “runaway retirement benefits,” that finding does not mean that benefits are optimally designed. The U.S. has a wide range in earnings, and workers’ earnings are strongly correlated with life expectancy.
A situation where low earners die early and high earners live much longer undermines many of the progressive aspects of the benefit design. The challenge in putting together a solvency package for Social Security is to correct a structure that increasingly benefits higher earners. Let’s talk first about the reasonableness of Social Security benefits — whether they seem overly generous compared with the past or to other countries — and then touch on the challenge raised by the enormous and growing difference in life expectancy.
The most basic way to gauge reasonableness is to look at the extent to which benefits “replace” preretirement earnings. The replacement rates shown in Table 1 below are for those claiming at age 65. Of course, reasonableness is in the eye of the beholder — but to my eye, the reported numbers do not seem too generous. Retirement benefits replace about 36% of preretirement earnings for the medium worker, with greater percentages for lower earners and lower for the higher paid.
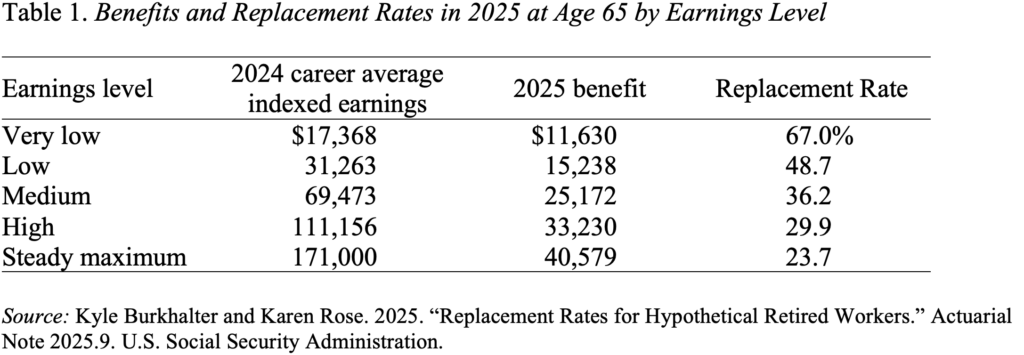
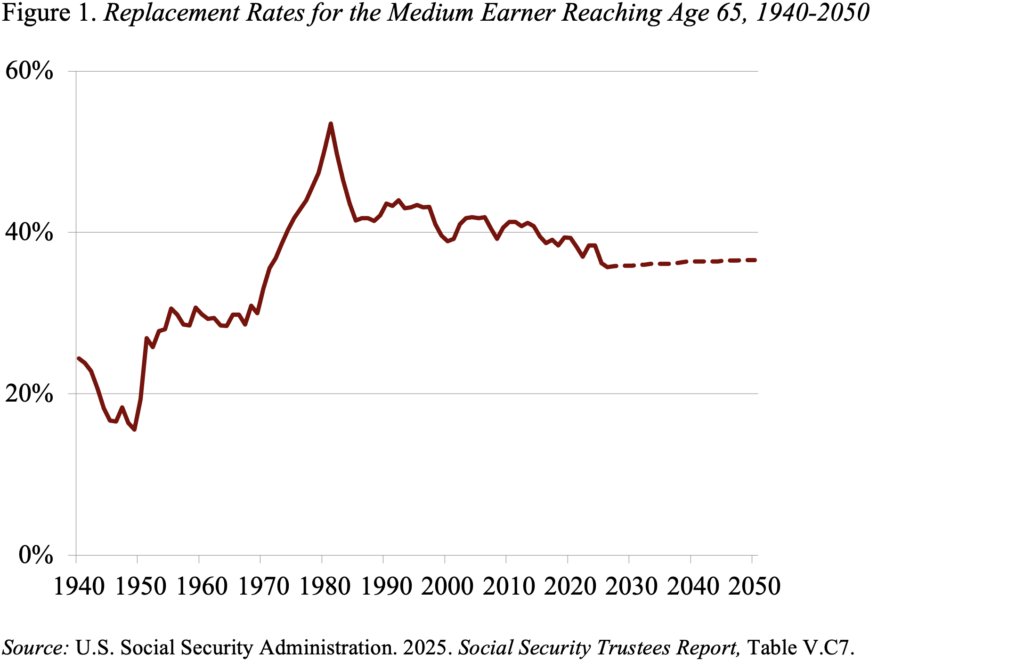
Figure 1 puts today’s replacement rates in historical context by showing replacement rates for people reaching age 65 in 1940 through 2050. The ultimate replacement rate of 36.6% is higher than the original rate for early retirees, and reduced from the exceedingly high rates that emerged from an error in the indexation of benefits in the 1970s.
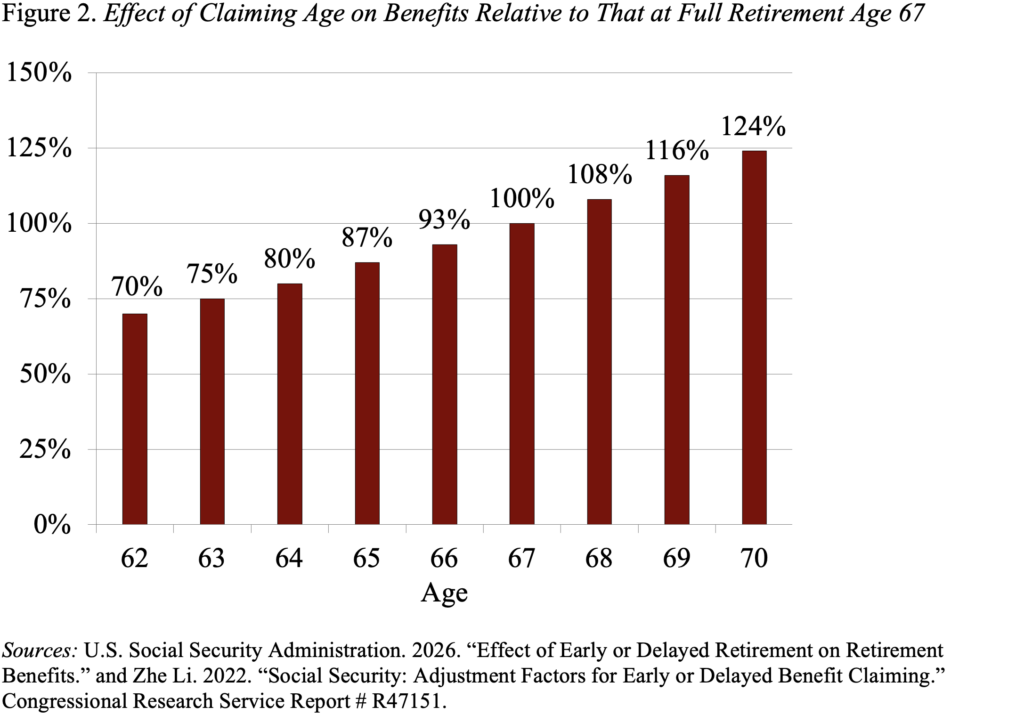
An additional dimension of generosity relates to when benefits are made available. Reduced monthly benefits are available at age 62 and, with delayed retirement credits, the highest monthly benefit is paid at age 70. Figure 2 shows how a worker’s claiming age affects their benefit relative to the amount available at the full retirement age of 67. In theory, the actuarial adjustments are designed so that the typical individual would receive the same lifetime benefits whenever they claim.
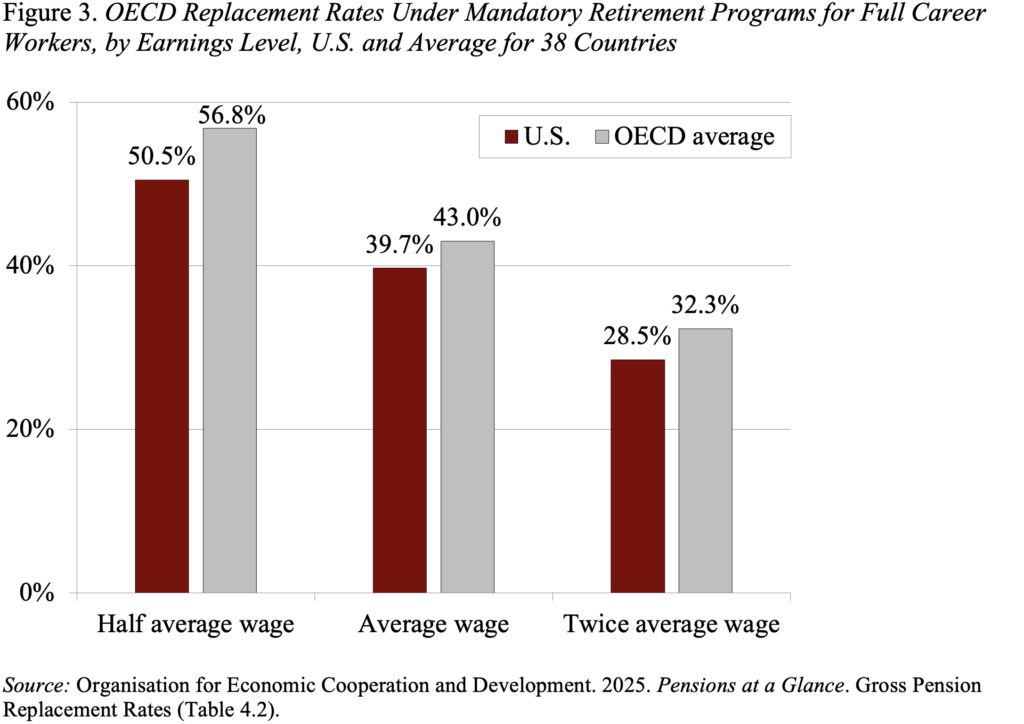
Another perspective on the reasonableness of the U.S. retirement system emerges by comparing Social Security to provisions and outlays in other countries. For this exercise, we need to turn to “Pensions at a Glance,” put out by the Organisation for Economic Co-operation and Development (OECD) in Paris. Replacement rates are reported for career workers at the average wage, as well as for those earning half and twice the average wage. For all three types of workers, the U.S. replacement rates are somewhat lower than the OECD average (see Figure 3)
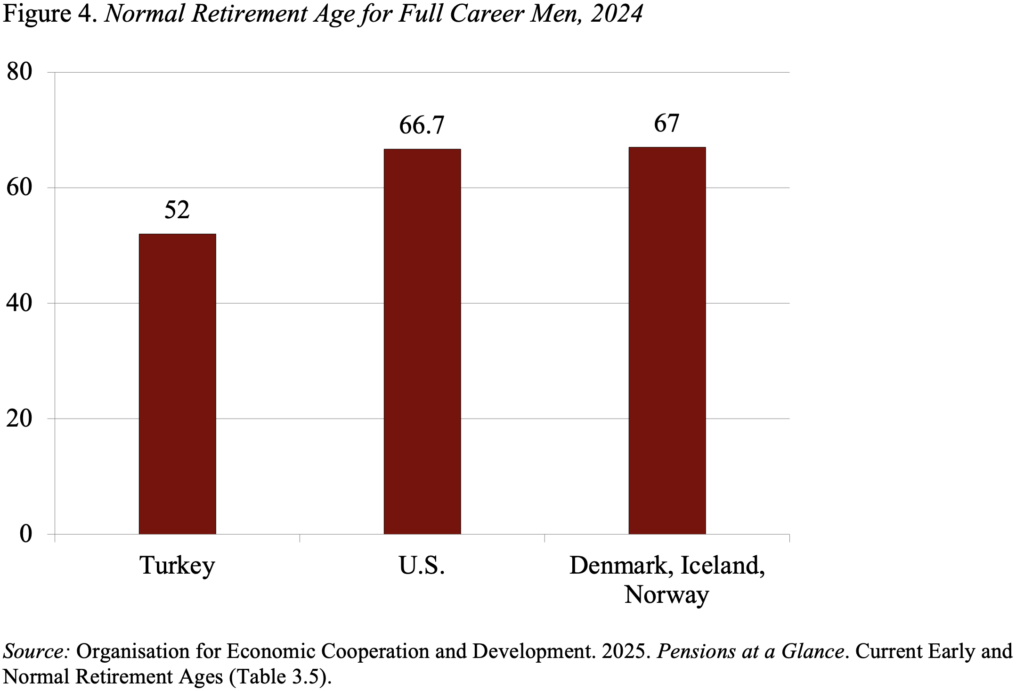
The OECD defines a country’s normal retirement age as the age at which all retirement benefits are available without penalty for early claiming, based on a full career from age 22. In 2024, the average OECD normal retirement age was 64.7 for men and 63.9 for women. For men, normal retirement ages ranged from 52 in Turkey to 67 in Denmark, Iceland and Norway (see Figure 4). The U.S., which was at 66.7 in 2024, joined the age-67 group in 2025.
In terms of public spending on government retirement programs, the U.S. again comes in slightly below the OECD average (see Figure 5).

Thus, looking at the benefit levels and replacement rates in the U.S. and across the OECD countries provides no evidence for a “runaway” retirement system. That said, the U.S. has a diverse population and one where life expectancy is strongly related to earnings (see Figure 6).
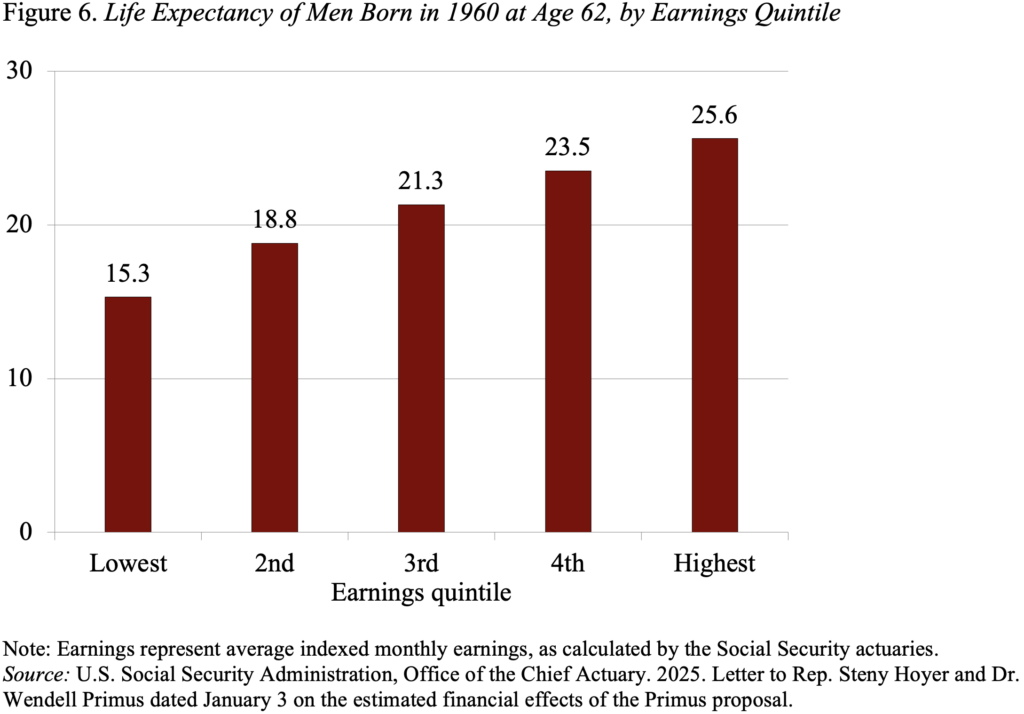
As a result, a disproportionate share of benefits goes to high earners who claim large benefits unreduced for early-retirement penalties, and who live for a very long time. Achieving a better distribution of benefits should be a key factor in any package to solve Social Security’s financial shortfall.