



How Well Do Individuals Recognize Family Risks to Retirement Security?


The brief’s key findings are:
- Retirement planning often takes into account economic or health risks that people may face, but family-related risks tend to get less attention.
- Family risks include both structural changes – like widowhood or divorce – and financial support for adult children or aging parents.
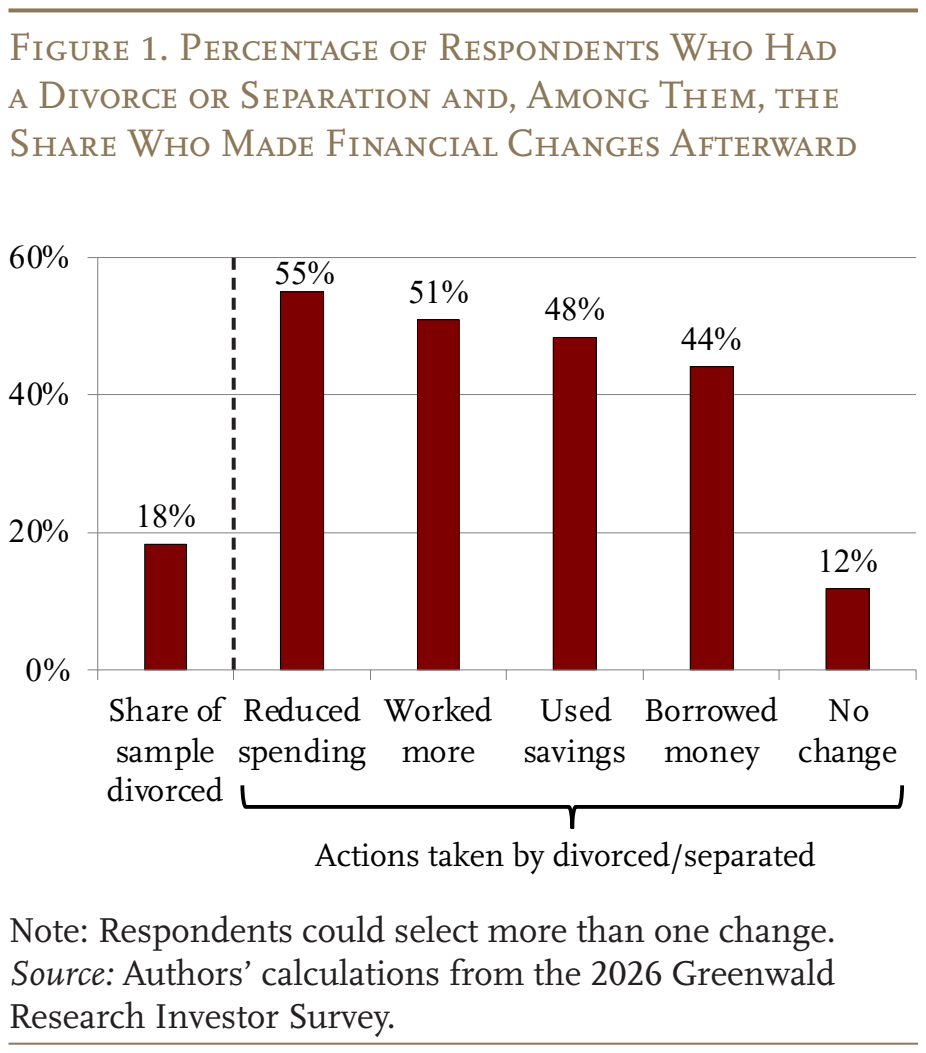
- A new survey finds these risks are common and costly: about 20 percent are divorced and half have given more than $10,000 in the past 10 years.
- In addition, people have reasonable perceptions of the risks of divorce, widowhood, and aid to parents, but underestimate helping adult children.
Introduction
Retirement planning often emphasizes market, health, and longevity risks, but being part of a family also introduces other important risks – such as changes in family structure and financial support to family members. Structure changes result primarily from widowhood or divorce, events that can undermine both income and wealth. Financial support consists mainly of transfers to adult children or aging parents that may be planned – like helping a child buy a house – or unplanned – like paying for a parent’s medical care.
Existing research suggests that both types of risks are relatively common – and costly. However, households may not adequately understand or prepare for such costs. A new CRR study tackles these topics to update previous work and fill in the gaps.1 The key data source for the analysis is a new survey of Americans ages 45-80, fielded in March 2026 and developed in collaboration with Jackson National Life Insurance and Greenwald Research.
This brief – the first of two – examines how often households experience family risks, the associated costs, and how accurately they anticipate future risks. The next brief will explore how households respond to family risks and how prepared they are for them.
The current brief proceeds as follows. The first section provides background on family risks from previous research. The second section introduces the data used in the analysis. The third section presents the results. The final section confirms that family risks remain common and costly. It also finds that households appear to have reasonable perceptions about the risks of divorce, widowhood, and aid to parents, but they substantially underestimate support for adult children.
Background
This section documents key findings from previous research on the frequency and costs of family risks; the extent to which households recognize these risks; and what questions remain unresolved.
Prevalence and Cost of Family Risks
A significant research literature exists on both family structure changes and family financial support, which is briefly summarized here.2
Family Structure Changes. Historically, widowhood was the main way that marriages among older adults dissolved. In recent decades, the prevalence of widowhood has fallen – from more than one-third of older adults in 1990 to about one-fifth in 2022, due to longer lifespans and shifts in marital patterns.3 At the same time, many financial obligations persist – such as high housing expenses.4 As a result, poverty rates are significantly higher among the newly widowed.5
While widowhood has declined, the risk of divorce in later life has risen sharply: the share of older adults divorced in 2022 was nearly triple the 1990 level.6 Many who divorce later in life go on to remarry or repartner, which can offset some of the financial and mental strain of dissolution, though remarriages themselves have a higher risk of divorce.7 Gray divorce is also costly, particularly for women – largely because they are less likely to repartner.8 Poverty among women eligible for Social Security is nearly twice as high for those who divorced after age 50 as for those who divorced earlier.9
Family Financial Support. Beyond marital dissolution, family financial support is also common. Roughly one-third of households ages 65 and older make a transfer over a two-year period, and among parents with children ages 18-34, 59 percent report helping a child financially in the past year.10 Notably, financial transfers are often episodic rather than steady; and they tend to track major life events.11 These transfers can affect retirement security by diverting resources from a household’s own saving. For example, about one-fifth of households ages 45-75 that provide support report a significant hit to retirement savings or income.12
Awareness of Family Risks
Households appear to underestimate their exposure to family risks, though direct evidence is thin. On the risk of death of a spouse, prior research has shown that individuals systematically underestimate how long they will spend widowed.13 With respect to divorce, marriage license applicants expect their own marriages to last despite accurate knowledge of population divorce rates.14 When it comes to providing financial assistance to family members, the vast majority of respondents ages 50 and older say they have not budgeted for this situation.15
Gaps in the Research Literature
Several gaps in existing research stand out. First, it remains unclear whether older workers and retirees are well aware of family-related risks – that is, whether their own expectations align with the rates documented in the literature. Second, for family structure changes, prior research rarely asks households about the likelihood of divorce and widowhood within a given timeframe. Finally, for family financial support, the literature rarely distinguishes transfers made for anticipated milestones from those prompted by unplanned shocks, which may carry different implications for retirement security. All of these areas are covered in our analysis.
Data
To answer the underexplored questions, we fielded a new survey of adults from middle age through retirement age, developed in collaboration with Jackson National and Greenwald Research. We compare the survey responses with the historical experiences of households in the University of Michigan’s Health and Retirement Study (HRS). The new survey was designed to capture both actual experiences with family-related financial risks over the past decade and expectations about such demands going forward. The HRS provides the benchmark to which survey respondents’ expectations are compared.
For the survey, Greenwald Research interviewed 1,019 individuals ages 45-80 online from March 24-31, 2026.16 A defining feature of the survey is that – in examining financial support to family – “significant” support is defined relative to each household’s own finances. Respondents first report the amount at which support to a family member would begin to be a significant burden; that amount (with a floor of $2,500) is then inserted into the questions about past and expected support. The measure therefore captures transfers large enough to strain each specific household’s finances, rather than using transfer amounts above a common dollar threshold. For expectations of future risks, respondents are asked to rate the likelihood of each event over the next 10 years on a five-point scale, from “not at all likely” to “very likely.”
Data on historical experience come from the HRS, a biennial survey representative of the U.S. population over age 50 and their spouses. To benchmark expectations of changes in family structure, we calculate actual 10-year rates of divorce and widowhood among comparable respondents in the HRS.17 For family financial support, we use HRS questions on whether the household gave financial help to adult children or parents in the prior two years and, if so, how much. Summing across waves of the HRS gives the total transferred over the decade in 2026 dollars.18
Results
This section documents how often households in the new survey have experienced family risks and at what cost and then asks whether households expect these risks going forward and compares their expectations to the historical data from the HRS.
How Common and Costly Are Family Risks?
Both types of family risks are relatively common among the sample households. With respect to changes in family structure, because the sample is relatively young and few respondents have been widowed, we focus on past experiences with divorce. Nearly one in five report that they or their current spouse have been divorced or separated for more than a year. Among this group, nearly nine in ten made adjustments to their finances to cope with the fallout (see Figure 1).19
Turning to family financial support, households appear to have limited room to help out. Respondents were first asked the amount at which a payment to support a family member would begin to be a significant burden. For about half of them, that threshold is $5,000 or less; only 22 percent put the threshold above $10,000. For our analysis, we use $2,500 as a lower boundary for defining “significant burden.”
Yet, financially demanding needs for support from family members are common. Over the past decade, 41 percent of parents of adult children gave them significant support (see Figure 2). Among respondents with living parents or in-laws, 28 percent have made significant transfers to them.
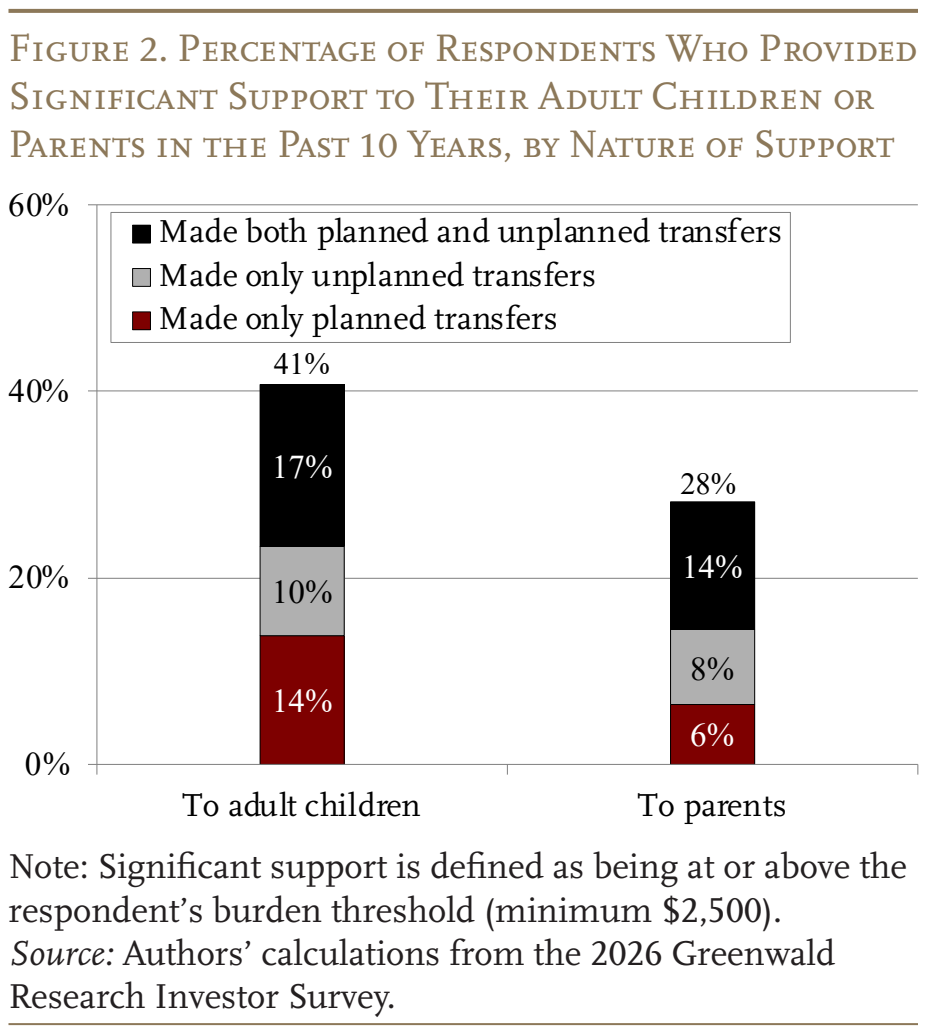
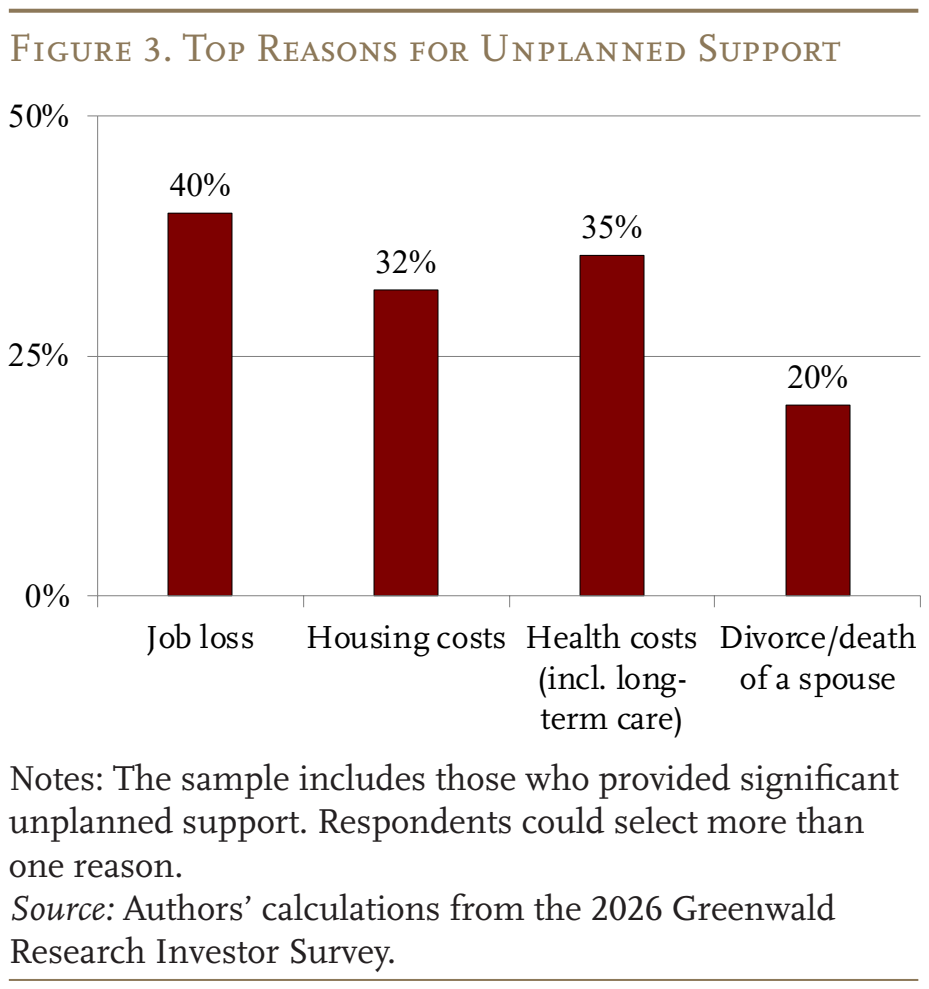
It may also be useful to look at whether the needs of family members are unplanned or planned, given that unforeseen events could potentially pose greater financial challenges. Notably, 27 percent of parents of adult children provided significant support for unplanned needs only or in combination with planned life events (see the first set of black and gray bars in Figure 2). Planned support covers events such as weddings, a home down payment, and education costs. Unplanned support, by contrast, stems mostly from job loss, housing costs, medical and long-term care costs, and a divorce or death of a spouse experienced by an adult child or parent (see Figure 3). This pattern is consistent with evidence that transfers generally track major life events among recipients.
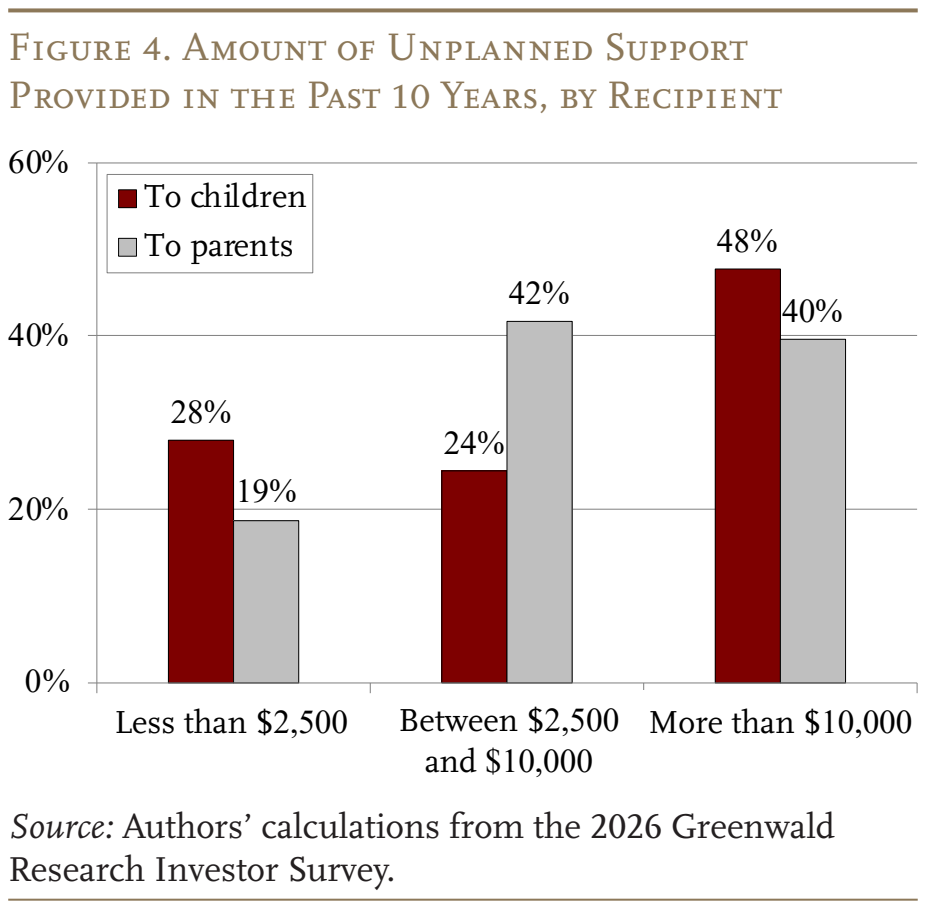
Amounts of transfers are also large – about half of those who provided unplanned support to adult children, and two in five of those who supported parents, gave more than $10,000 over the past 10 years (see Figure 4).
Both types of family risk, then, are common and weigh on household finances. Whether these costs are manageable may depend in part on whether households see them coming. The next section compares what households expect with what similar households have actually experienced in the past.
Do Households Recognize Family Risks?
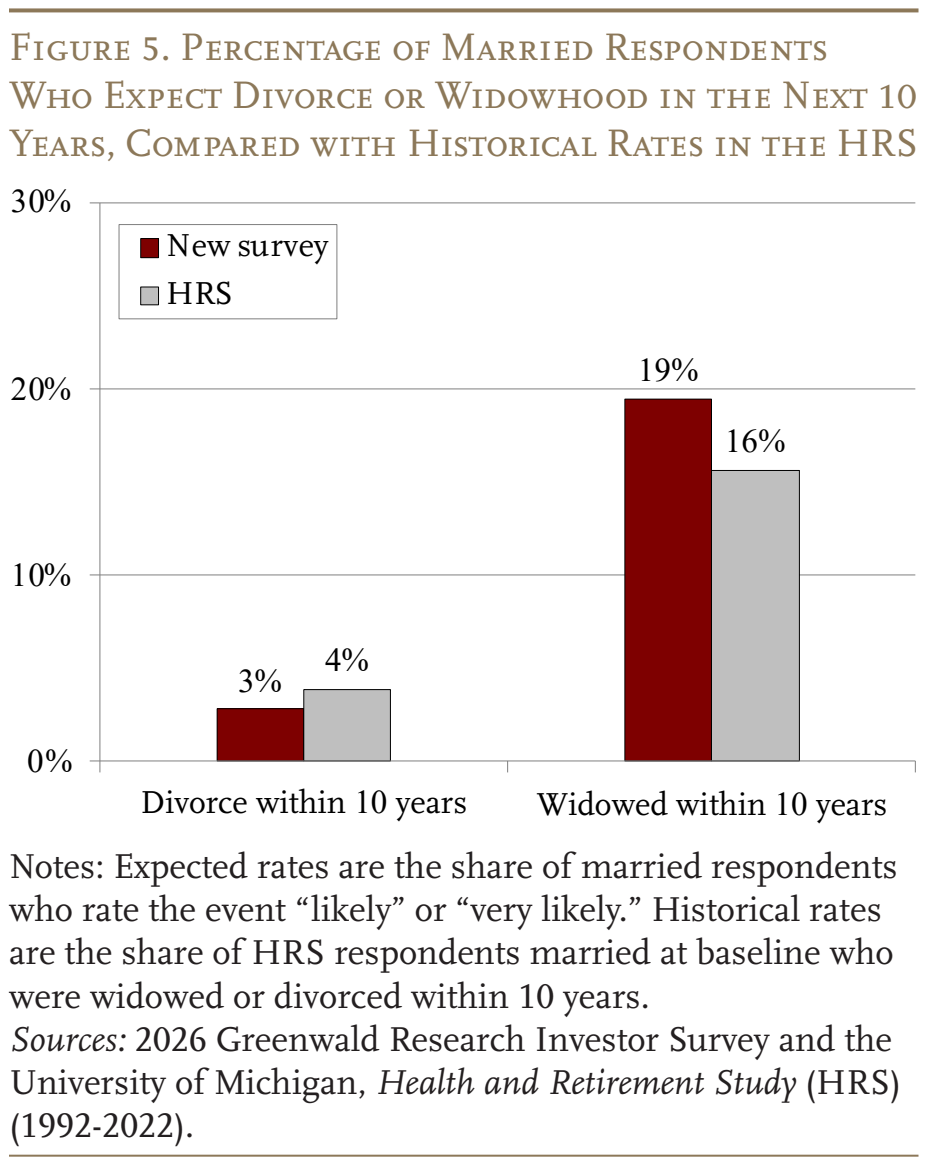
To assess whether households’ expectations about future risks are realistic, this section benchmarks our respondents against actual data on the occurrence of these risks among HRS respondents who are similar in age, gender, race, and marital status. The results show that married respondents predict family structure changes fairly well (see Figure 5). Their expectations of divorce closely match historical experience: 3 percent say divorce is likely or very likely in the next 10 years, compared with a 10-year divorce rate of 4 percent among married HRS respondents. Expectations of facing widowhood within the next 10 years slightly exceed that of historical experience.20
Turning to family assistance, households seem to underestimate the likelihood of significant transfers to adult children but not transfers to parents.21 Twenty-nine percent of respondents with adult children think it is at least somewhat likely that they will provide support of $2,500 or more to an adult child in the next 10 years (see Figure 6). Yet, over a decade, twice as many HRS households transfer $2,500 or more to children. In contrast, expectations about providing at least $2,500 in support to parents track experience very closely: roughly 20 percent for both the new survey respondents and the HRS households.22
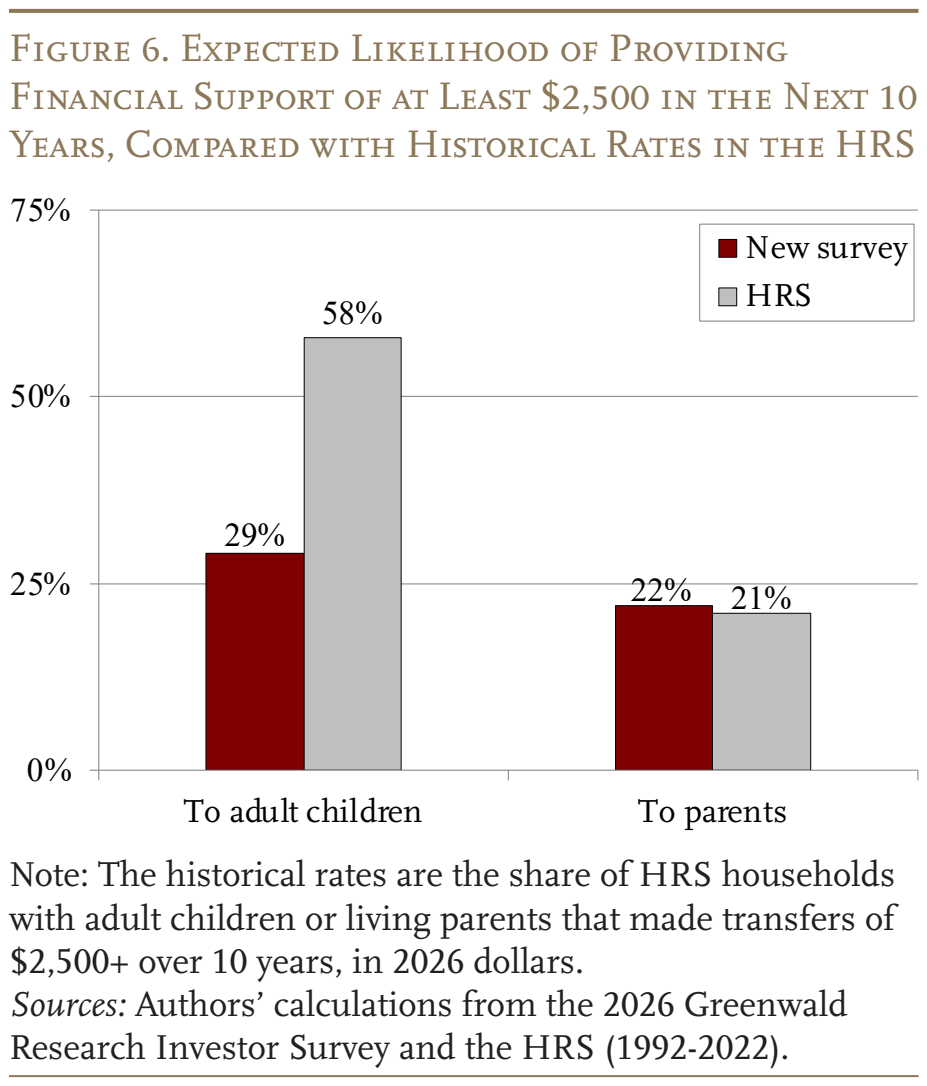
Overall, the results confirm that family-related risks are widespread and often costly, and suggest that households are often aware of these risks but substantially underestimate the likelihood of providing financial assistance to adult children.
Conclusion
Family ties can help individuals insure against risks to retirement security, but they also introduce new risks. Our findings show that households often incur costs due to family risks that exceed the level they feel comfortable absorbing. Such risks include widowhood and divorce, and transfers to other family members. Nearly one in five respondents have experienced a divorce, and two in five parents of adult children have provided support at a level they consider a significant financial burden. These risks (or their timing) can be unplanned or planned. The findings further show that households appear to have a reasonably accurate perception of most of these risks when compared to hard data, with one major exception: they greatly underestimate the need to help adult children.
The second brief in this series will take the next step by assessing how households respond to family risks when they occur, the tools they could use to mitigate risks (e.g., prenuptial agreements, wills, beneficiary designations), and their use of such tools.
References
Baker, Lynn A. and Robert E. Emery. 1993. “When Every Relationship Is Above Average: Perceptions and Expectations of Divorce at the Time of Marriage.” Law and Human Behavior 17(4): 439-450.
Brown, Susan L. and I-Fen Lin. 2022. “The Graying of Divorce: A Half Century of Change.” Journal of Gerontology: Social Sciences 77(9): 1710-1720.
Carr, Deborah and Kristen W. Springer. 2010. “Advances in Families and Health Research in the 21st Century.” Journal of Marriage and Family 72(3): 743-761.
Chen, Anqi, Siyan Liu, and Gal Wettstein. 2026. “Do Near-Retirees and Retirees Recognize Family Risk and Are They Prepared for It?” Working Paper 2026-4. Chestnut Hill, MA: Center for Retirement Research at Boston College.
Compton, Janice and Robert A. Pollak. 2021. “The Life Expectancy of Older Couples and Surviving Spouses.” PLOS ONE 16(5): e0250564.
Consumer Financial Protection Bureau. 2014. “Snapshot of Older Consumers and Housing Debt.” Report. Washington, DC.
Health and Retirement Study, RAND HRS Longitudinal File and Family Data File Public Use Dataset. 2025. Produced and Distributed by the University of Michigan with Funding from the National Institute on Aging (Grant Number NIA U01AG009740). Ann Arbor, MI.
Holden, Karen C., and Hsiang-Hui Daphne Kuo. 1996. “Complex Marital Histories and Economic Well-Being: The Continuing Legacy of Divorce and Widowhood as the HRS Cohort Approaches Retirement.” The Gerontologist 36(3): 383-390.
Hou, Wenliang. 2020. “How Accurate Are Retirees’ Assessments of Their Retirement Risk?” Working Paper 2020-14. Chestnut Hill, MA: Center for Retirement Research at Boston College.
LIMRA. 2025. “Family Financial Support and Retirement Security.” Report. Windsor, CT.
Lin, I-Fen and Susan L. Brown. 2021. “The Economic Consequences of Gray Divorce for Women and Men.” The Journals of Gerontology: Series B 76(10): 2073-2085.
Lin, I-Fen, Susan L. Brown, and Anna M. Hammersmith. 2017. “Marital Biography, Social Security Receipt, and Poverty.” Research on Aging 39(1): 86-110.
Loo, Elizabeth and Susan L. Brown. 2024. “Marital Status Distribution of U.S. Adults Aged 65 and Older, 1990-2022.” Family Profiles FP-24-04. Bowling Green, OH: Bowling Green State University, National Center for Family & Marriage Research.
McGarry, Kathleen. 2016. “Dynamic Aspects of Family Transfers.” Journal of Public Economics 137: 1-13.
Merrill Lynch. 2016. “Family & Retirement: The Elephant in the Room.” New York, NY: Merrill Lynch Wealth Management and Age Wave.
Minkin, Rachel, Juliana Menasce Horowitz, Kim Parker, and Carolina Aragão. 2024. “Parents, Young Adult Children and the Transition to Adulthood.” Report. Washington, DC: Pew Research Center.
Smock, Pamela J., Ebony Tzoc, and Deborah Carr. 2024. “Gender and the Economic Consequences of Divorce Across Race.” Demography 61(1): 73-98.
University of Michigan. Health and Retirement Study, 1992-2022. Ann Arbor, MI.
Endnotes
- Liu and Wettstein (2026). ↩︎
- For a detailed literature review, see the full paper (Liu and Wettstein 2026). ↩︎
- Loo and Brown (2024). ↩︎
- Consumer Financial Protection Bureau (2014). ↩︎
- Smock, Tzoc, and Carr (2024). ↩︎
- Loo and Brown (2024). ↩︎
- Carr and Springer (2010); and Brown and Lin (2022). ↩︎
- Lin and Brown (2021). ↩︎
- Lin, Brown, and Hammersmith (2017). ↩︎
- Hou (2020); and Minkin et al. (2024). Median transfers are modest – around $2,000 per year in 2026 dollars – but averages in the upper half of the distribution exceed $6,500 annually. ↩︎
- McGarry (2016). ↩︎
- Minkin et al. (2024); and LIMRA (2025). ↩︎
- Holden and Kuo (1996). Moreover, relying on individual life expectancies rather than joint survivor metrics mechanically understates the duration of widowhood (Compton and Pollak 2021). ↩︎
- Baker and Emery (1993). ↩︎
- Merrill Lynch (2016). ↩︎
- The full survey is restricted to respondents with plausible exposure to family-related financial risk: those who were unmarried and had neither living children nor living parents or stepparents were excluded. ↩︎
- The new survey respondents have an average age of 61. To match the life stage of this typical respondent, we keep HRS respondents whose ages were around 60 at baseline and who were re-interviewed 10 years later, so that each household’s experience can be observed over the same horizon the survey covers, leaving roughly 15,000 HRS respondents. For more details, see the full paper (Liu and Wettstein 2026). ↩︎
- The HRS transfer rates are likely lower bounds: the sample requires interviews only at baseline and 10 years later, so transfers made during any missed intermediate interview go unrecorded. ↩︎
- Although the survey does not record the age at divorce/separation, these adjustments are consistent with the large and lasting declines in wealth and living standards documented for gray divorce. ↩︎
- For divorce and widowhood, including respondents who answered “somewhat likely” raises expected rates to 9 percent for divorce and 50 percent for widowhood. ↩︎
- Expected rates for transfers use a broader definition than for family structure changes: respondents who rated significant support at least “somewhat likely.” As a result, the gap for adult children is, if anything, understated. ↩︎
- Notably, expectations differ significantly by past experiences with transfers. Respondents who have supported an adult child or parent in the past are far more likely to expect to do so again. ↩︎



Chen, Anqi, Siyan Liu, and Gal Wettstein. 2026. "How Well Do Individuals Recognize Family Risks to Retirement Security?" Issue in Brief 26-23. Chestnut Hill, MA: Center for Retirement Research at Boston College.