
How Has the Variance of Longevity Changed Over Time?
The brief’s key findings are:
- Life expectancy is a key consideration for retirement planning.
- The uncertainty around this expectation, however, is what makes lifetime income sources like Social Security and annuities so valuable.
- The analysis explores how the variance around average longevity has changed over time by race, education, and gender.
- Most groups saw a modest increase in the variance, except for low-education Black men who saw a decline due to a drop in deaths at younger ages.
- Importantly, Blacks and those with less education consistently show higher variance in lifespans, making lifetime income particularly valuable for them.
Introduction
Life expectancy and its swings over time receive significant attention from both academics and the public. Much less attention, however, is paid to the variation in lifespan around its average – the variance of longevity. However, it is precisely this unpredictability of age of death that makes lifetime income provided by Social Security and annuities so valuable.
In fact, the greater the variance in longevity, the more valuable is guaranteed lifetime income. And, recent studies have shown that the variance of longevity varies by race and education, with Black and lower-education individuals having greater dispersion than their counterparts. What has not been well documented is how this variance around life expectancy – and thus the value of guaranteed lifetime income – has changed over time.
This brief, which is based on a recent study, examines changes in the variance of longevity at older ages for the population as a whole, for different race/education subgroups, and for those who actually buy annuities.1 To assess the economic implications of changes in the variance, the analysis calculates its impact on the insurance value of fair life annuities.
The discussion proceeds as follows. The first section describes the variance of longevity and its implications. The second section discusses the methodology for constructing the life tables, calculating the variance of longevity, and estimating the impact of any change on the value of annuities. The third section presents the results for life expectancy and the variation around it, and the fourth section presents the welfare analysis to quantify the impact of changes in the variance of longevity. The final section concludes that longevity variance has trended modestly up over the past two decades for almost all the demographic groups explored, leading to a small increase in the value of guaranteed lifetime income.
Why Lifespan Variation Matters
The variation of longevity provides valuable information about mortality beyond life expectancy. It is precisely this uncertainty around the average lifespan that gives rise to “longevity risk” – the possibility of living an unusually long time and outliving one’s assets. Insuring against longevity risk through guaranteed lifetime income has become an important policy issue.
Conceptually, at the individual level, the variation in longevity has two components: the likelihood of premature death at younger ages and that of survival to older ages.2 Improvements in economic and medical conditions that reduce overall mortality rates contribute to longer life expectancy, but their impacts on the variance of longevity is ambiguous. While reducing mortality at younger ages lowers lifespan variation by compressing the distribution of the age-at-death toward the average, reducing mortality at higher ages increases lifespan variation by stretching the age-at-death distribution away from the average. Hence, the impact of economic and medical improvements depends on how the mortality reductions are distributed across ages.3
Aside from economic and technological trends affecting the full population, lifespan variation also differs by characteristics such as race and education.4 For example, Black and lower-education individuals, who generally have lower life expectancies, face greater variability in lifespan compared to their White and higher-education counterparts. This pattern reflects unequal access to economic and health-related resources. In particular, the higher lifespan variation among lower-educated individuals largely results from an excess of premature deaths from diseases and external causes, many of which are preventable.5
In addition to documenting the variation in longevity across population groups and over time, understanding the economic implications of these trends is important for researchers and policymakers. Studies based on lifecycle models suggest that a more dispersed age-at-death distribution, all else being equal, is less desirable.6 Moreover, as lifespan uncertainty is precisely the motivation for buying annuities, changing values of annuities can serve as a measure of the economic value of changing lifespan variation.7
Building on prior research, this study documents and compares the variation in longevity at older ages for the general population, various race/education groups, and annuitants. To quantify the magnitudes in relatable, dollar-value terms, the analysis also estimates the welfare implications of any changes in lifespan variations by calculating their effect on the value of annuities.
Data and Methodology
When available, this study relies on existing life tables and analyzes the variance of longevity they imply. For population-level life expectancy and variance of longevity, the study uses life tables from the Social Security Administration (SSA).8 For calculations by racial groups (non-Hispanic Black and non-Hispanic White) and educational attainment (low and high), the tables come from earlier work by the authors. The life tables for annuitants are constructed using data from the Society of Actuaries.9
The life tables provide the probability of dying at each future age, which yields the expected age of death and the standard deviation of possible ages of death around that mean age.
Then, the task is to determine whether a one-unit change in the standard deviation of longevity is big or small. To give a dollar value to these changes, the analysis takes a wealth equivalence approach. Specifically, it uses a simplified lifecycle model to calculate the longevity insurance value of annuities, which increases with the variance of longevity.10 This value is measured by the wealth equivalence of having an actuarially fair immediate annuity contract – that is, the amount of additional wealth an individual with an annuity would need to be persuaded to give it up. It is important to note that the goal here is not to evaluate annuities per se, but to use the change in the value of fair annuities as a measure of the magnitude of differences in lifespan uncertainty.
In the full study, the variance of remaining longevity is calculated at a number of key ages: 50, 62, 67, and 70. These are ages at which individuals can make meaningfully different decisions about their work and retirement plans, corresponding, respectively, to the age at which they can begin to make catch-up contributions to 401(k)s and IRAs; the earliest claiming age for Social Security; the full Social Security retirement age; and the maximum Social Security claiming age. For ease of exposition, this brief focuses on people at age 50, but the results for older ages are quite similar.
Results
The results include estimates of life expectancy and the standard deviation of lifespan over time.
Life Expectancy
Before looking into the variance of longevity, it is helpful to start with the patterns of life expectancy produced by the underlying data. Table 1 shows life expectancy at age 50 in selected years for females and males in the general population, in various race/education groups, and among annuitants.
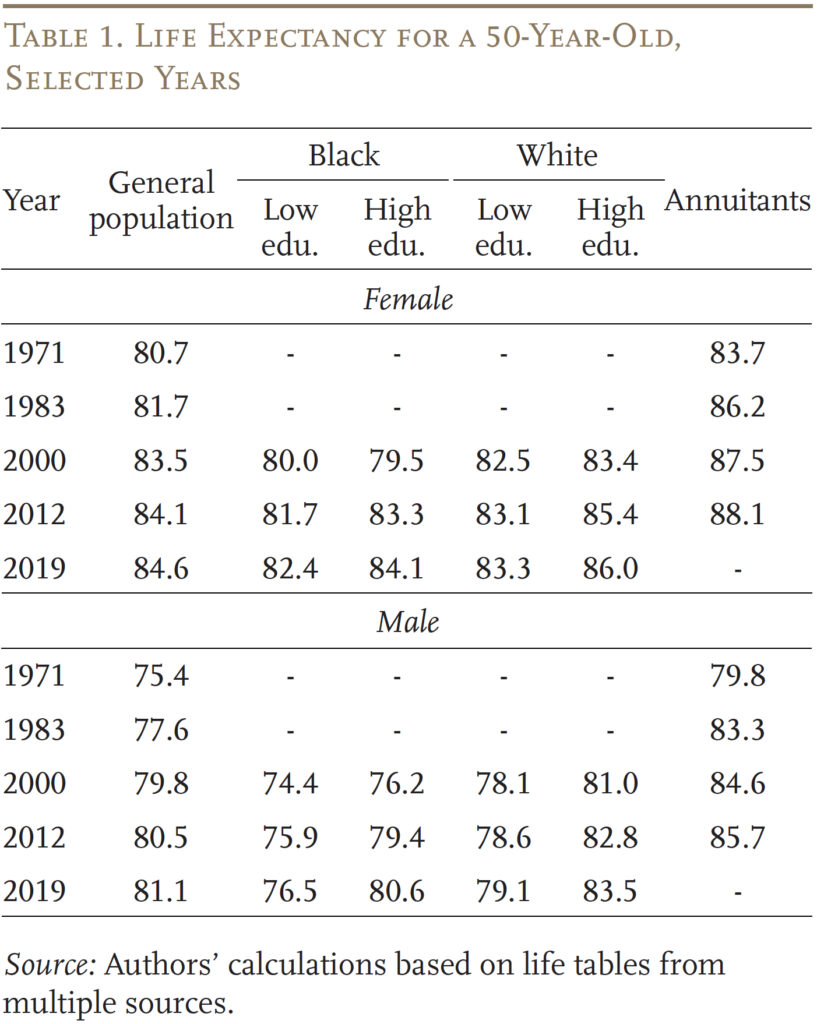
In terms of the level of life expectancy, the pattern is familiar: women, Whites, and higher-education individuals tend to live longer than their counterparts.11 And annuitants, who are generally wealthier and healthier than the general population,12 have significantly higher life expectancies in all years.
Also, as well documented, the life expectancy for the general population rose substantially from 1971 to 2019. Black individuals generally saw greater improvement compared to their White counterparts, and within racial groups, individuals in the higher education groups enjoyed greater improvement than those with less education. These trends are consistent with recent work showing declining racial gaps and increasing socioeconomic gaps in life expectancy.13 Annuitants not only have higher life expectancies but also saw greater improvements in expected lifespans than the population as a whole.
Note that the comparison between the life expectancies of race/education groups and the general population should be conducted with caution. The general population includes all demographic groups, while only Blacks and Whites are examined separately in this study. Hispanics and Asians tend to have a higher life expectancy than Whites, which raises the life expectancy for the population as a whole.14 In addition, differences in the underlying data sources can result in discrepancies in life expectancy estimates.15
Variance of Longevity
Moving from average life expectancy to variances around the average, the results show that for the general population the variance – i.e., the standard deviation around the expected age at death for 50-year-olds – has been remarkably stable (see Table 2).16 However, the measure has decreased slightly for females and increased slightly for males.
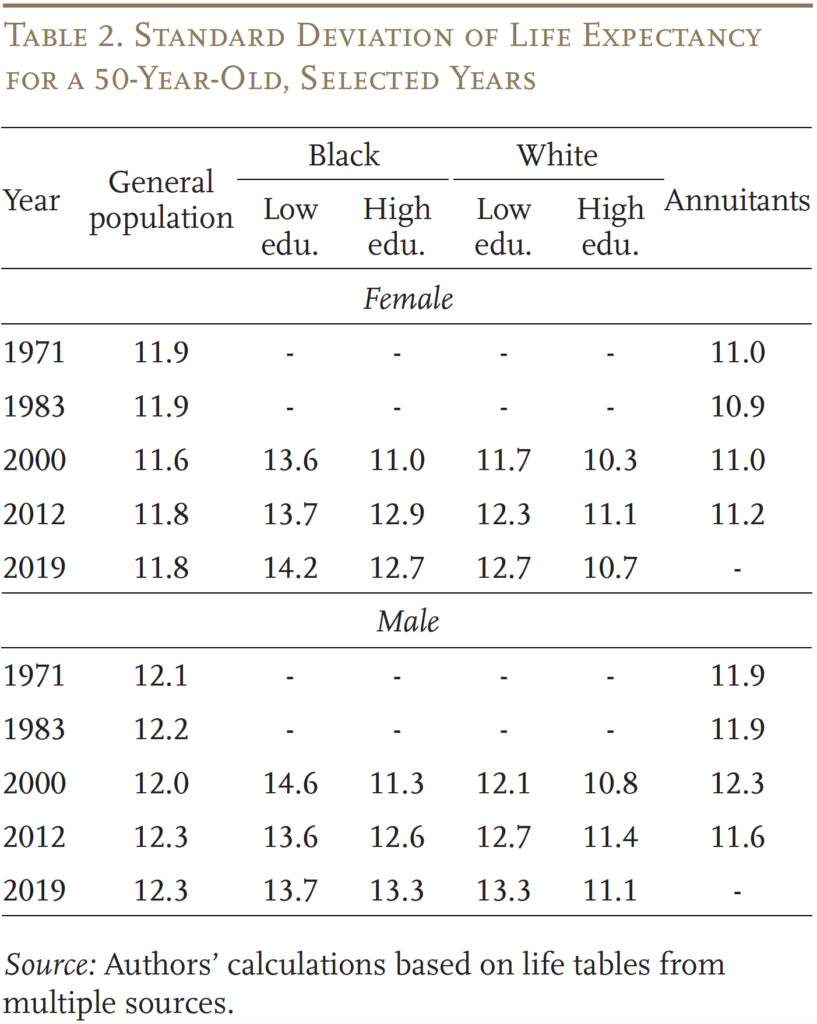
The pattern of lifespan variation at the population level masks meaningful differences across groups.17 In all years, lifespan dispersion is much greater for Blacks than for Whites. Similarly, within racial groups, individuals with less education face larger lifespan variation than those with more. These results are consistent with previous studies.18
With respect to time trends, over the period 2000-2019 the standard deviation increased in almost all gender-race-education groups (especially high-education Black and low-education White individuals). The notable exception was low-education Black males, where the standard deviation of longevity declined from 14.6 years in 2000 to 13.7 years in 2019.
The result for annuitants is what one would expect – they have a smaller variance of longevity than the general population. In 2012, when the most recent mortality tables for annuitants are available, the standard deviation of life expectancy for annuitants was 0.6 to 0.7 years lower than those for the general population and close to the standard deviation values for high-education Whites. The values for annuitants were relatively stable over the period from 1971 to 2012.
While the previous discussion has quantified the magnitude of the changes in the variance of longevity, it is virtually impossible to gauge the importance of these changes over time. Fortunately, the variance in longevity is directly linked to the value of annuities, because insuring against longevity risk is the very motivation to purchase annuities. Exploiting this relationship can provide some economic measure of the impact of changes in standard deviations.
Welfare Implications of Changes in Lifespan Variation
For a more intuitive sense of the size of the change in lifespan variation, we turn to a welfare analysis of annuities. Specifically, we calculate the wealth equivalence of a fair annuity purchased at age 50, as a share of starting wealth. This measure implies, for example, that if an annuity has a wealth equivalence of 0.2 for a 50-year-old, that individual holding a fair annuity would need to be compensated by 20 percent of their wealth at age 50 to give it up.
Table 3 presents the wealth equivalence values by gender, race, and education over the 1971-2019 period. Overall, the magnitude of the longevity insurance value of fair annuities is substantial. For the general population, the value of fair annuities equals about 25-50 percent of a typical person’s initial wealth at age 50.
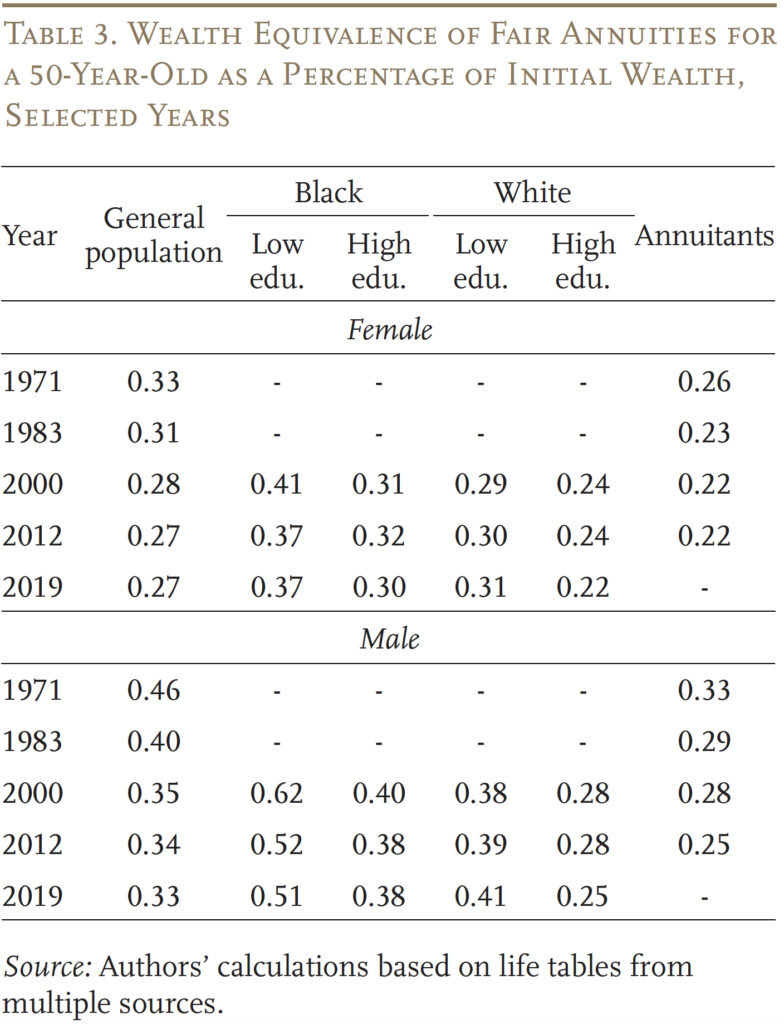
Looking across gender-race-education groups, the pattern of the wealth equivalence of annuities is consistent with that of the standard deviation of lifespan. That is, the wealth equivalence values are higher for males, Blacks, and individuals with less education who tend to have more dispersed lifespans compared to those in their counterpart groups. Annuitants, the group that actually purchases annuities, derive less longevity insurance value from fair annuities than the general population, due in part to their relatively low lifespan variation.19
That said, the general decline in wealth equivalence is a surprising result given the stable or slightly increasing pattern of the standard deviation of age at death documented in the previous section. Such increased dispersion should, in theory, result in a stable or increasing longevity insurance value of annuities. This conflict can be reconciled by noting that the theory assumes that life expectancy holds steady. In fact, life expectancy rose over the period, which in a lifecycle model reduces the value of fair annuities.20
To disentangle the effects of life expectancy and the variance of longevity on the wealth equivalence of annuities, we estimate a regression that relates (for each subgroup at each starting age) the changes in wealth equivalence to the changes in life expectancy and the standard deviation of longevity. The regression results (see Figure 1) confirm that wealth equivalence of a fair annuity increases with the dispersion of lifespan and decreases with rising life expectancy. The estimated coefficients suggest that, on average, a one-year increase in the standard deviation of longevity is associated with an increase in wealth equivalence of 6.8 percent of initial wealth, holding life expectancy constant, while a one-year increase in life expectancy is associated with a decrease in wealth equivalence worth 3.1 percent of initial wealth. While the coefficient for the change in life expectancy is smaller for each one-year increase, life expectancy rose by more years than did the standard deviation of longevity – so the net effect is to reduce the wealth equivalence of annuities.
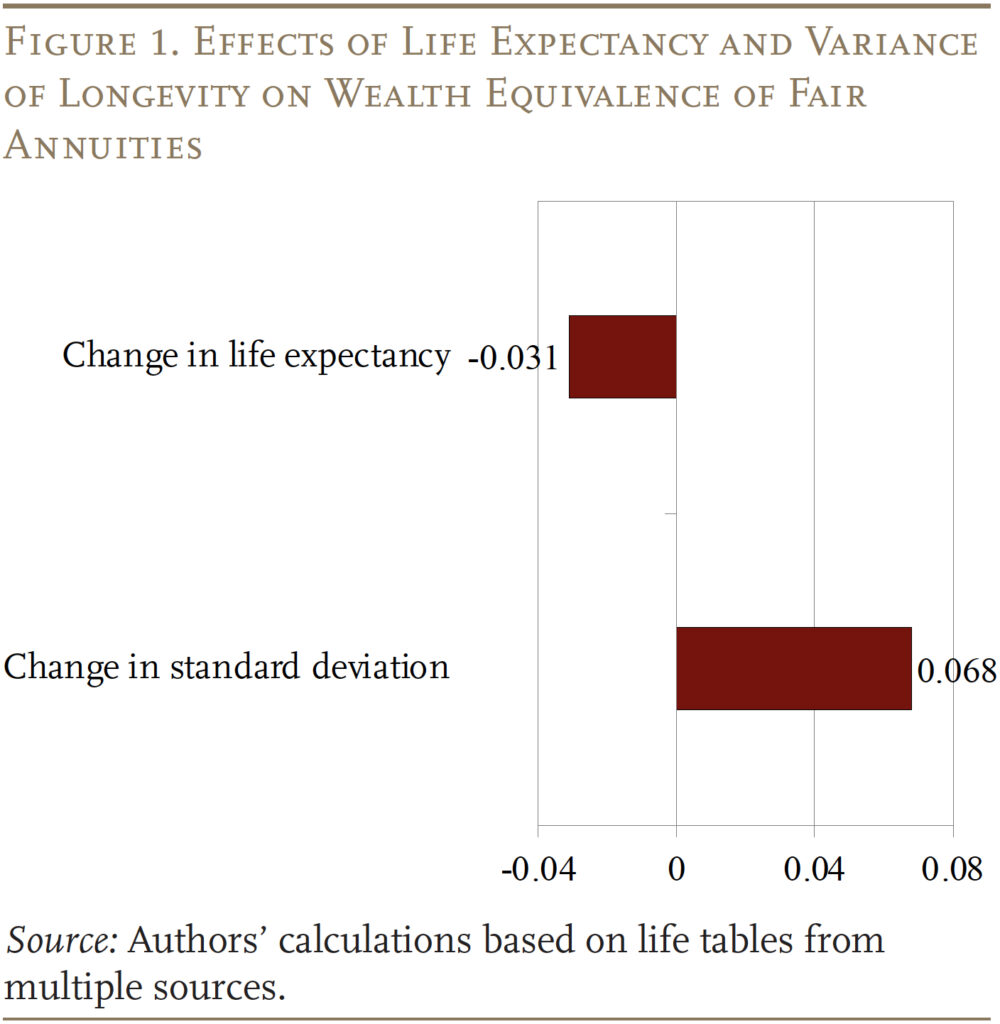
The exercise above allows us to answer our main question: how big has the change in lifespan variation – by itself – been over the past decades? To do so, we first calculate the changes in the standard deviation of longevity from 2000-2019 for each population group (except for annuitants, for whom the most recent data are 2012), then multiply them by the coefficient for changes in the standard deviation of longevity (6.8 percent for a one-year change) in Figure 1. The calculations yield the total impact of the changes in lifespan variation over this period on the wealth equivalence of annuities, assuming life expectancy had remained unchanged.
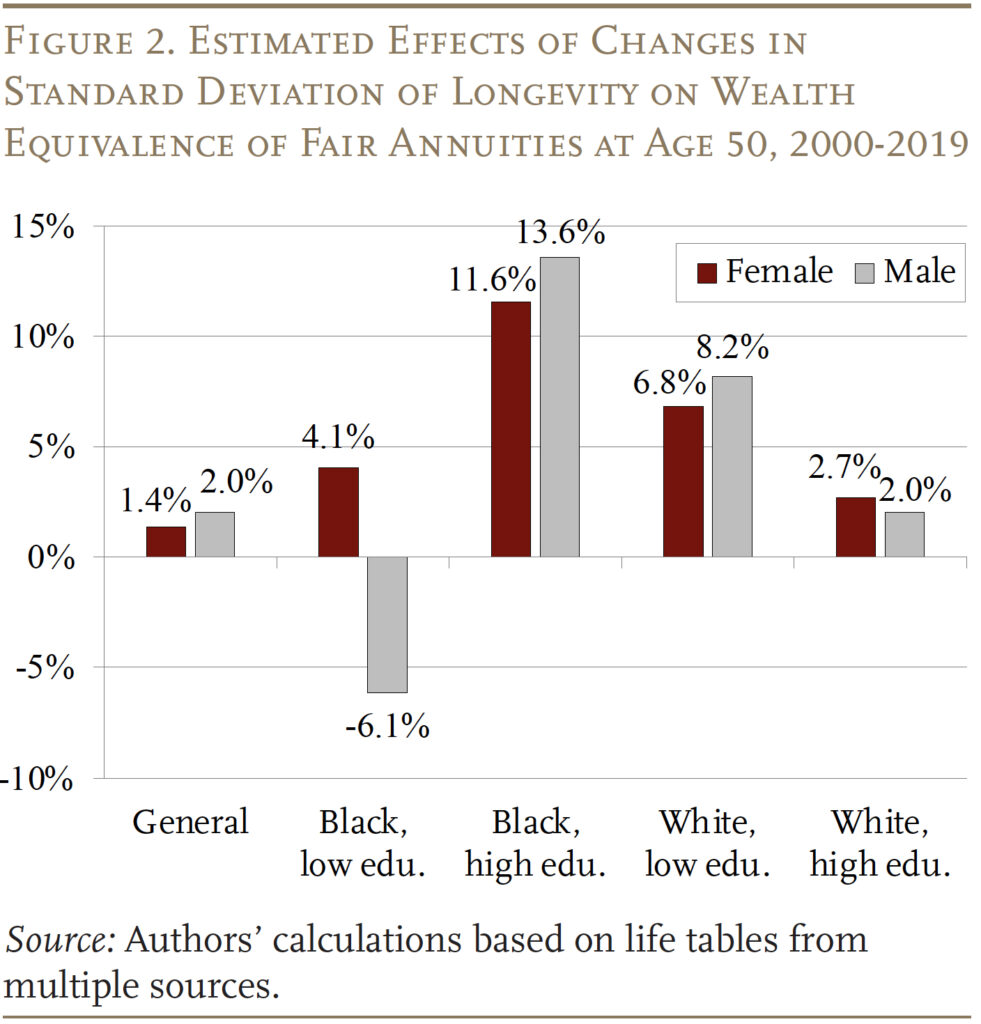
Figure 2 shows the result of this calculation for individuals at age 50 by population group. The stable time pattern of lifespan variation for the general population yields a small increase in wealth equivalence of less than 2 percent. Across gender-race-education groups, the largest increases in wealth equivalence attributable to changes in lifespan variation are concentrated in high-education Black individuals (11.6 percent for females and 13.6 percent for males) and low-education White individuals (6.8 percent for females and 8.2 percent for males). High-education White individuals and low-education Black females have also seen an increase in wealth equivalence due to variance-of-longevity changes, though the magnitudes are modest (2 to 4 percent). The decrease in the standard deviation of longevity among low-education Black males, which is unique across gender-race-education groups, is associated with a 6.1-percent decrease in the value of longevity insurance for this group.
Conclusion
The variation of lifespan is an essential component of mortality patterns and has important welfare and economic implications. Lifespan variation represents the uncertainty regarding age at death faced by individuals and is precisely why sources of lifetime income, such as annuities, are valuable. Moreover, the differences in lifespan variation by gender, race, and education reflect an important dimension of inequality.
This brief documents how the variance of longevity has changed over time for the general population, gender-race-education groups, and annuitants. The results show that the population-level variance of longevity has generally stayed stable over the past five decades, although the pattern varied across groups.
Quantifying the welfare implications of change in the variance of longevity using the wealth equivalence of fair annuities shows that the increase in value for the general population is modest – roughly 2 percent – although the gains for some groups were substantially more. Overall, this study provides further evidence that those who do not typically buy annuities actually stand to gain substantially from them and these gains have been persistent over time.
References
Arapakis, Karolos, Gal Wettstein, and Yimeng Yin. 2023. “What Is the Insurance Value of Social Security by Race and Socioeconomic Status?” Working Paper 2023-14. Chestnut Hill, MA: Center for Retirement Research at Boston College.
Barbieri, Magali. 2018. “Investigating the Difference in Mortality Estimates Between the Social Security Administration Trustees’ Report and the Human Mortality Database.” Working Paper No. 2018-394. Ann Arbor, MI: Michigan Retirement Research Center.
Brown, Dustin C., Mark D., Hayward, Jennifer Karas Montez, Robert A. Humme, Chi-Tsun Chiu, C, and Mira M. Hidajat. 2012. “The Significance of Education for Mortality Compression in the United States.” Demography 49(3): 819-840.
Brown, Jeffrey R. 2002. “Differential Mortality and the Value of Individual Account Retirement Annuities.” In The Distributional Aspects of Social Security and Social Security Reform, edited by Martin Feldstein and Jeffrey B. Liebman, 401-446. Chicago, IL: University of Chicago Press.
Chetty, Raj, Will Dobbie, Benjamin Goldman, Sonya Porter, Crystal Yang. 2024. “Changing Opportunity: Sociological Mechanisms Underlying Growing Class Gaps and Shrinking Race Gaps in Economic Mobility.” Working Paper 32697. Cambridge, MA: National Bureau of Economic Research.
Edwards, Ryan D. 2013. “The Cost of Uncertain Life Span.” Journal of Population Economics 26(4): 1485-1522.
Gillespie, Duncan O. S., Meredith V. Trotter, and Shripad D. Tuljapurkar. 2014. “Divergence in Age Patterns of Mortality Change Drives International Divergence in Lifespan Inequality.” Demography 51(3): 1003-1017.
Hill, Latoya and Samantha Artiga. 2023. “What is Driving Widening Racial Disparities in Life Expectancy?” Issue Brief. San Francisco, CA: KFF.
Johnson, Catherine O., Alexandra S. Boon-Dooley, Nicole K. DeCleene, et al. 2022. “Life Expectancy for White, Black, and Hispanic Race/Ethnicity in the U.S. States: Trends and Disparities, 1990 to 2019.” Annals of Internal Medicine 175(8): 1057-1067.
Milevsky, Moshe A. 2020. “Swimming with Wealthy Sharks: Longevity, Volatility and the Value of Risk Pooling.” Journal of Pension Economics & Finance 19(2): 217-246.
Nuss, Ken. 2020. “Retirees with a Guaranteed Income Are Happier, Live Longer.” (December 24). Washington, DC: Kiplinger.
Sasson, Isaac. 2016. “Trends in Life Expectancy and Lifespan Variation by Educational Attainment: United States 1990-2010.” Demography 53(2): 269-293.
U.S. Social Security Administration. 2024. “Cohort Life Tables.” Washington, DC.
van Raalte, Alyson A., Anton E. Kunst, Olle Lundberg, Mall Leinsalu, Pekka Martikainen, Barbara Artnik, Patrick Deboosere, Irina Stirbu, Bogdan Wojtyniak, and Johan P. Mackenbach. 2012. “The Contribution of Educational Inequalities to Lifespan Variation.” Population Health Metrics 10(3): 1-10.
Wettstein, Gal, Alicia H. Munnell, Wenliang Hou, and Nilufer Gok. 2021. “The Value of Annuities.” Working Paper 2021-5. Chestnut Hill, MA: Center for Retirement Research at Boston College.
Wettstein, Gal and Yimeng Yin. 2025. “How Has the Variance of Longevity Changed Over Time?” Working Paper 2025-1. Chestnut Hill, MA: Center for Retirement Research at Boston College
Yaari, Menahem E. 1965. “Uncertain Lifetime, Life Insurance, and the Theory of the Consumer.” Review of Economic Studies 32(2): 137-150.
Zhang, Zhen and James W. Vaupel. 2009. “The Age Separating Early Deaths from Late Deaths.” Demographic Research 20(29): 721-730.
Endnotes
- Wettstein and Yin (2025). ↩︎
- Zhang and Vaupel (2009) define a threshold age that separates early and late deaths. ↩︎
- See Gillespie et al. (2014). ↩︎
- Brown (2002); Sasson (2016); and Wettstein et al. (2021). ↩︎
- van Raalte et al. (2012). ↩︎
- See Yaari (1965). Also, using lifecycle models, Edwards (2013) estimates that the average American would be willing to give up about half a life year in exchange for one year less in the standard deviation of longevity. ↩︎
- Wettstein et al. (2021) found that annuitization is more valuable for Black individuals than for White ones, which corresponds to the much larger variance in lifespan for the former for every gender-education combination. Arapakis, Wettstein, and Yin (2023) similarly estimate the longevity insurance value of the Social Security retirement benefit and find that values are highly correlated with the standard deviation of lifespan across gender-race-education groups. ↩︎
- U.S. Social Security Administration (2024). ↩︎
- See the full paper (Wettstein and Yin 2025) for further details. ↩︎
- The longevity insurance value of fair life annuities calculated in this study does not represent the values of annuity products available on the market. Our calculation uses a simplified lifecycle model and is intended to be a convenient, while meaningful, measure of the welfare implications of the uncertainty of lifespans that can be compared across demographic and education groups and over time. ↩︎
- An exception is that low-education Black women are estimated to have slightly higher life expectancy than their higher-education counterparts in 2000. Future work will explore the robustness of this finding. ↩︎
- Nuss (2020). ↩︎
- Chetty et al. (2024). ↩︎
- See, for example, Johnson et al. (2022) or Hill and Artiga (2023). ↩︎
- See Barbieri (2018). ↩︎
- The standard deviation of age at death decreases with the starting age, as individuals survive the uncertainty of death at early ages. ↩︎
- Disparity by socioeconomic status group also contributes to the population-level measures; as noted, the calculations of population-level measures, which are based on SSA life tables, also include demographic groups other than Black and White individuals. ↩︎
- Brown et al. (2012); Sasson (2016); Milevsky (2020); and Wettstein et al. (2021). ↩︎
- Annuitants’ lower overall mortality rates also contribute to this outcome, because the wealth equivalence calculations are based on group-specific actuarially fair annuities, the annual payment of which decreases with overall mortality levels. ↩︎
- The mechanism behind the negative association between life expectancy and wealth equivalence of actuarially fair annuities has not been examined in the literature and is beyond the scope of this study. Roughly speaking, the deferral of mortality credits to later ages, when remaining wealth is smaller, leads to a smaller willingness-to-pay for an annuity at younger ages. Accordingly, the widespread improvement in life expectancy over the past decades has driven down the wealth equivalence of fair annuities in this simple model despite the stable or upward trends in the variance of longevity. ↩︎


