
How Much Could Will-Writing Reduce the Racial Wealth Gap?
The brief’s key findings are:
- One reason for the persistence of the racial wealth gap could be that Black households are far less likely than their White counterparts to have a will.
- Having a will leads to larger bequests, and those who receive an inheritance are more likely to have more wealth and leave their own bequest.
- The analysis explored how much equalizing will-writing rates between Black and White households could narrow the wealth gap.
- The results show that eliminating the will-writing gap would have narrowed the wealth gap by – a modest but meaningful – 10 percent over three generations.
Introduction
The gap in wealth between Black and White households has plagued the United States for more than a century. One reason for the lack of progress may be a disparity in will-writing by race – Black households are far less likely to have a valid will than their White counterparts. Having a will is associated with leaving larger bequests, and those who receive more in inheritances are also more likely to leave a legacy themselves. Thus, adopting a will would likely increase the wealth of all future generations and reduce the racial wealth gap.
To estimate the possible impact of wills, this brief, which is based on a recent study, explores how much equalizing will-writing rates between Black and White households would have narrowed the wealth gap over the past few generations.1 A complicating factor is that not all the correlation between will-writing and bequests is causal: many individuals write wills because they wish to leave a bequest rather than the other way around. To account for this likelihood, the analysis uses two approaches, one more reduced-form and one more structural. We refer to these approaches as “top-down” and “bottom-up.” While neither approach is perfect, together they provide useful upper and lower bounds for the impact of will-writing on wealth.
The discussion proceeds as follows. The first section presents background on the racial wealth gap, the racial “will gap,” and the theory behind why wills might increase household wealth across generations. The second section details the two analytical approaches used to estimate how eliminating the will-writing gap could affect the wealth gap. The third section describes the results. The final section concludes that eliminating the racial gap in will-writing could narrow the wealth gap by a modest but meaningful 10 percent over three generations.
Background
This section describes the basic facts on the racial wealth gap and its evolution, and summarizes the existing literature on the racial “will gap.”
The Racial Wealth Gap: Past and Present
Between 1880 and 1950, the ratio of White-to-Black household wealth declined dramatically. However, since then, progress has stalled. In 2019, the racial wealth gap remained at 6-to-1, with evidence that it has been growing wider since the 1980s (see Figure 1).2
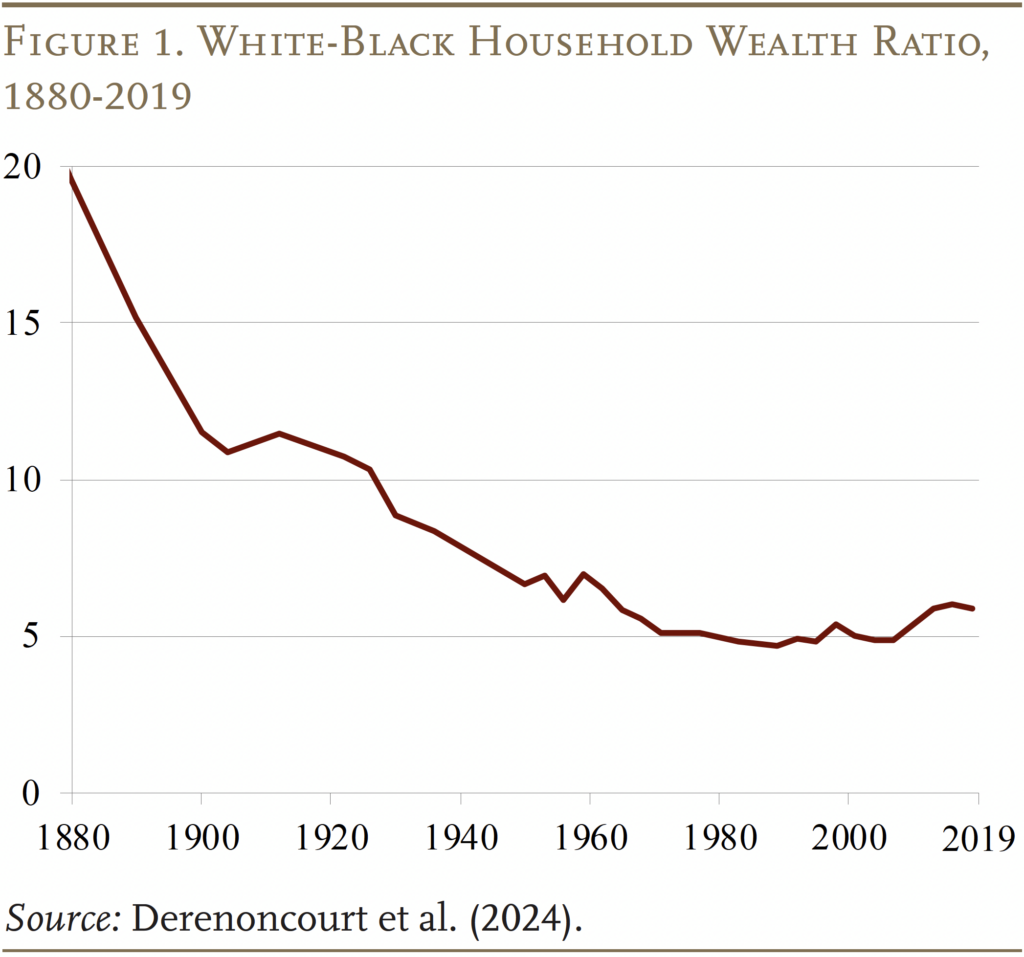
The current racial wealth gap is much larger than one would expect if White and Black households had enjoyed equal rates of saving and equal returns on their assets. In this case, the process of convergence would have resulted in a 3-to-1 gap in 2020.3 The fact that the current ratio is twice this benchmark is mostly due to lower saving rates for Black households. However, in the last few decades, racial differences in asset returns have become increasingly important – a pattern that has driven the recent widening of the racial wealth gap.
Researchers have explored why Black investors earn lower returns than their White counterparts. Partially, the difference is due to different portfolios. Black households tend to hold a larger share of their wealth in housing than financial assets – particularly equities – and housing yields lower returns than equities over the long run.4 To some extent, however, the racial difference in returns also reflects lower returns on the same type of asset. For example, house-value appreciation is lower for Black homeowners, a consequence of differences in location and foreclosure rates.5
The main activity explored in this brief – will-writing – straddles the two explanations for the slow convergence in wealth between Black and White households. That is, both lower saving rates and lower returns are associated with the racial gap in will-writing. On the racial difference in saving rates, the evidence suggests that individuals with a will intend to leave larger bequests and also are more likely to meet those expectations, suggesting they are putting aside more resources for future generations.6 Furthermore, those who receive an inheritance are more likely to leave a bequest themselves, compounding these generational gains and increasing the racial wealth gap.7
In addition, some portion of the racial difference in returns may also be related to the gap in wills.8 Legal experts routinely argue that dying intestate is a particular problem when the estate is modest and the largest asset is the house, where multiple heirs are often unable to coordinate on maintaining or selling the property, destroying value in the process.9 Alternatively, if the intended beneficiaries are living in the decedent’s home, the distribution to a large number of beneficiaries could result in the forced sale of the property. Hence, a racial difference in the dissipation of assets when bequeathed, driven by a racial gap in wills, is a possible contributor to the racial wealth gap that has not received much attention thus far.
The Black-White Will Gap
Given the potential impact of will-writing on savings, leaving bequests, and maintaining the value of transferred assets, the Black-White gap in will-writing helps explain why the racial wealth gap has increased in recent decades. Indeed, Black individuals receive fewer and smaller inheritances than White ones, and are also less likely to intend to leave a bequest or to have a valid will.10
Specifically, Black households are 20 percentage points less likely to have a valid will than their White counterparts, even after adjusting for characteristics such as wealth, education, presence of living children, and having received an inheritance in the past.11 Similarly, Black respondents also report significantly lower probabilities of leaving substantial bequests to their heirs. Moreover, when examining the realized estates of decedents, those who had a will were significantly more likely to attain their bequest expectations.
The current study builds on these findings, and asks whether closing the racial will gap could contribute to closing the racial wealth gap. In particular, we ask how much the racial wealth gap would have shrunk over the last three generations if Black households had the same will-writing rates as Whites.
Data and Methodology
Answering this question involves comparing two wealth estimates for representative White and Black households: one in which the Black and White will-writing rates are held at their current levels, and one in which the Black rate is increased to that of White households. The analysis starts with an initial White-Black wealth gap estimated as of 1980 for households with a head ages 60-70 – an age span when households are enjoying their peak lifetime wealth. All the analysis is based on data from the Health and Retirement Study (HRS), a longitudinal panel survey of a representative sample of households ages 50 and older.12 The analysis then tracks the wealth of representative White and Black households over three 20-year generations – 2000, 2020, and 2040.
For this analysis, the estimates of wealth across generations rely crucially on two relationships: 1) received inheritances and late-life wealth; and 2) late-life wealth and bequests. Given the potential sensitivity of the results to these relationships, the analysis uses two complementary approaches: a reduced form “top-down” approach, which estimates both relationships directly; and a structural “bottom-up” approach, which estimates the impact of inheritances on wealth indirectly, by applying assumed returns to a received inheritance.
The Top-Down Approach
The top-down approach allows the data to directly inform how received inheritances translate into later-life wealth and, through the wealth-bequest relationship, into eventual transfers to the next generation. That is,
Late-life wealth = f (inheritances and control variables)
where late-life wealth is household wealth at ages 60-70, inheritances are the total received over the life of the household, and controls include information about the head’s gender, race, marital status, children, and retirement status.
Bequests are then a function of the household’s late-life wealth (housing and non-housing), defined benefit (DB) wealth (which is treated separately because it is not bequeathable), and the same control variables as above.
Bequests = f (late-life wealth, DB wealth, has a will, and control variables)
The advantage of the top-down approach is that the myriad of ways that an inheritance can be applied are left open to recipients. For example, they could use the money to fund investments in physical or human capital (such as healthcare or education); they could use it as a buffer for the pursuit of a riskier but more rewarding occupation; or they could use it to finance consumption.
The disadvantage of this approach is omitted variable bias. That is, if high socioeconomic status recipients are more likely to receive inheritances and be wealthy in later life, the top-down approach may overestimate the effectiveness of bequests in increasing the wealth of subsequent generations. For example, if the children of upper-class families are more likely to be high earners, or to marry into other wealthy families, their eventual wealth should not be attributed solely to the inheritance they receive.
The Bottom-Up Approach
To avoid this problem, the bottom-up approach focuses on the market mechanisms through which an inheritance might increase later-life wealth. That is, inheritances are either consumed or invested. To the extent they are invested, they earn market returns. This approach excludes any other factors that might be correlated with receiving an inheritance, such as marrying well. It requires analyzing housing wealth and financial wealth separately because they earn different returns and play a different role in bequests. The relevant equation for both housing and non-housing wealth is:
Housing bequest / Non-housing bequest = f (housing wealth, non-housing wealth, DB wealth, has a will, and control variables)
Estimating the Change in Wealth across Generations
With the coefficients from these regressions in hand, the bequest from each generation to its subsequent generation can be estimated by plugging in the mean values of all controls, and taking account of late-life wealth by race and the relevant will-writing rate. This process yields the predicted bequest left by each generation, which is then divided by the average number of children to obtain an estimated inheritance per child (3.3 children for the Black households and 2.8 for the White ones). This quantity then becomes an input to a second estimation: predicting the late-life wealth of the successor generation given the inheritances they receive.
The process is slightly more complicated for the bottom-up approach, because it requires a number of assumptions. First, the marginal propensity to consume out of inheritances is assumed to be 0.06 for housing wealth and 0.15 for non-housing wealth.13 The average age at which households receive an inheritance is assumed to be 58.14 After consumption, the model projects 22 years of growth for housing and non-housing wealth, bringing households to age 80 – roughly the life expectancy at age 58.15 Robustness checks included in the full paper show that the final results are relatively insensitive to the return and holding-period assumptions.
Together, the top-down and bottom-up approaches yield results that can bound the impact of will-writing on the racial wealth gap.
Results
This section begins with the results of the top-down analysis, followed by those from the bottom-up approach.
Top-Down Results
To produce the top-down results, the first step is to estimate the wealth/inheritance and bequest/wealth relationships described in the first two equations on the previous page. This reduced-form approach shows that an additional dollar of inheritance received throughout life is associated with $3 of additional wealth at ages 60-70. So, inheritances do matter.
In terms of bequests, Figure 2 shows that an additional $1,000 in bequeathable assets around ages 60-70 is associated with $517 more left in bequests. An additional $1,000 in present value of DB wealth, meanwhile, translates into $206 of additional bequest (presumably through reducing reliance on other assets during retirement). All else equal, having a will is associated with an increase in the average bequest of $80,507. So, wills do matter.
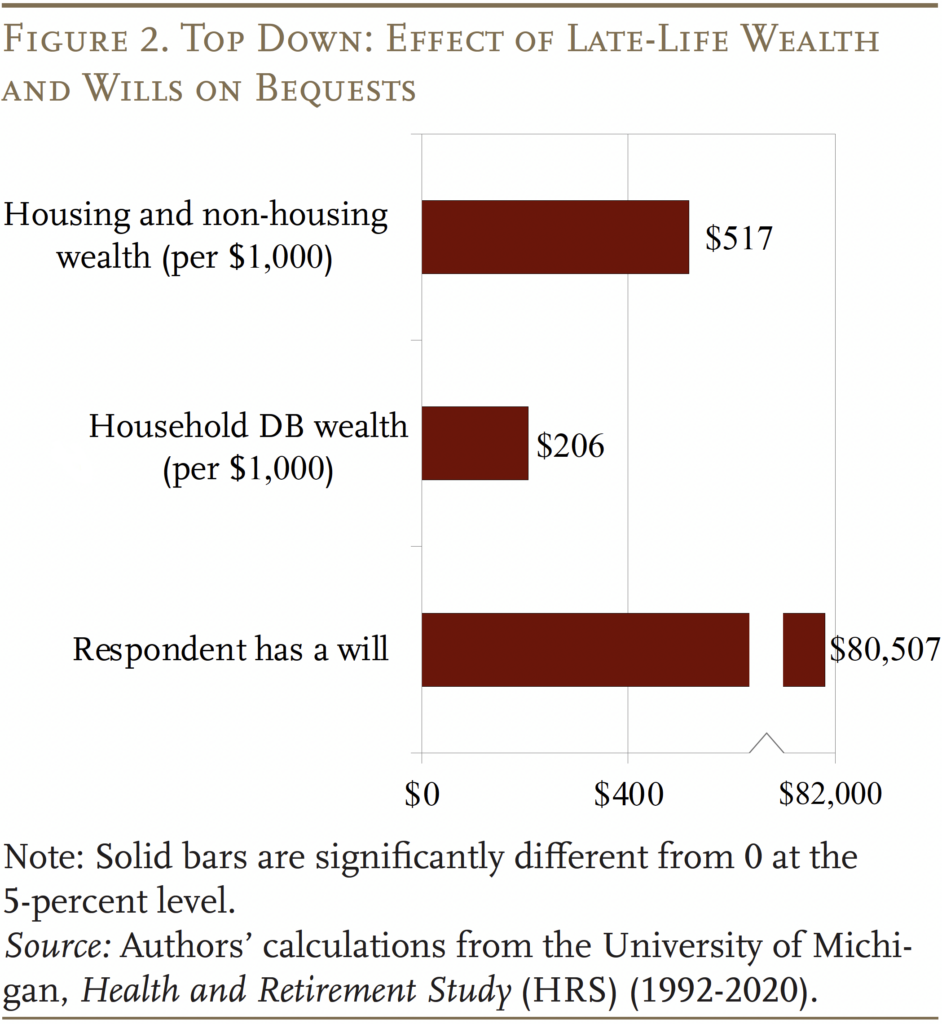
Given these estimates, Table 1 shows the results of the top-down analysis. The analysis starts in Generation 0, where 79 percent of White household heads have a will compared with 34 percent of Black households. In 1980, White wealth was $621,700, while Black wealth was only $219,200 (all in 2020 dollars), leading to a White-Black wealth ratio of 2.84. (This ratio differs from the numbers in Figure 1 due to differences in data sources and in the wealth measure used.)
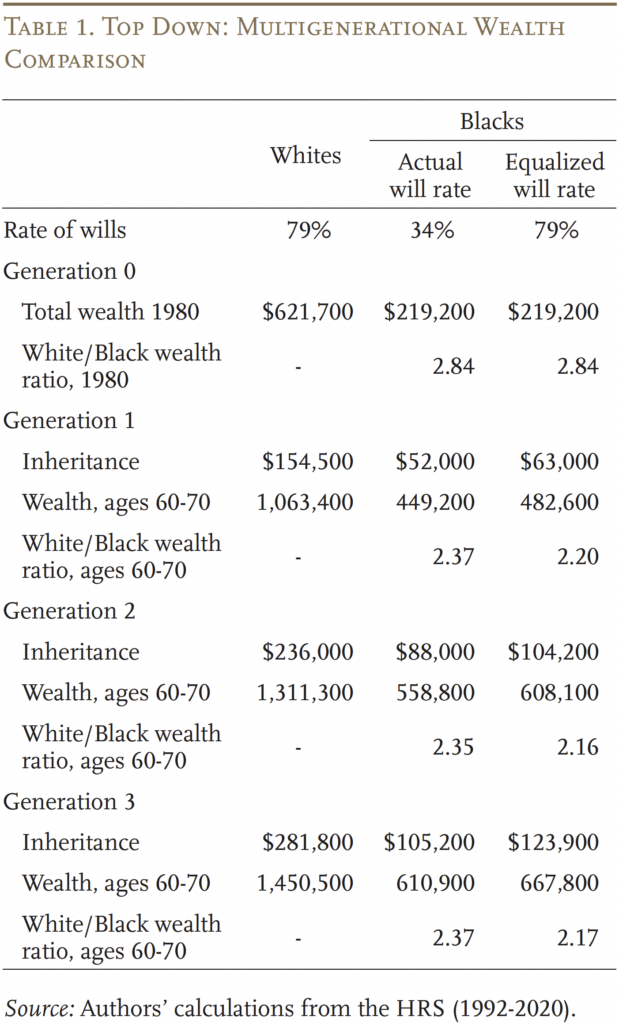
From this starting point, the first generation receives an inheritance of $154,500 for White beneficiaries and $52,000 for Black ones, under the actual will-writing rate. The estimated relationship between inheritances received and late-life wealth then translates into $1,063,400 in late-life wealth for White households, and $449,200 for Black ones, yielding a White-Black wealth ratio of 2.37. On the other hand, under the assumption that Black and White individuals have the same will-writing rate of 79 percent, the resulting White-Black wealth ratio is only 2.20.
Iterating over the next two generations yields a final White-Black wealth ratio of 2.37 (under actual will-writing rates) and 2.17 (under equal will-writing rates) by the third generation. In other words, if will-writing rates had been equal starting in 1980, the racial wealth gap would have declined by nearly 10 percent over three generations.
Bottom-Up Results
As discussed, the bottom-up approach requires estimating housing and non-housing wealth separately (see Figure 3). Unsurprisingly, the value of housing wealth is strongly associated with housing bequests, while non-housing wealth is similarly strongly associated with eventual non-housing bequests. In particular, every $1,000 of housing wealth is associated with an additional $651 of housing bequests, while every $1,000 of non-housing wealth is associated with a further $465 of non-housing bequests. The amount of DB wealth has only a modest association with both housing and non-housing bequests.16
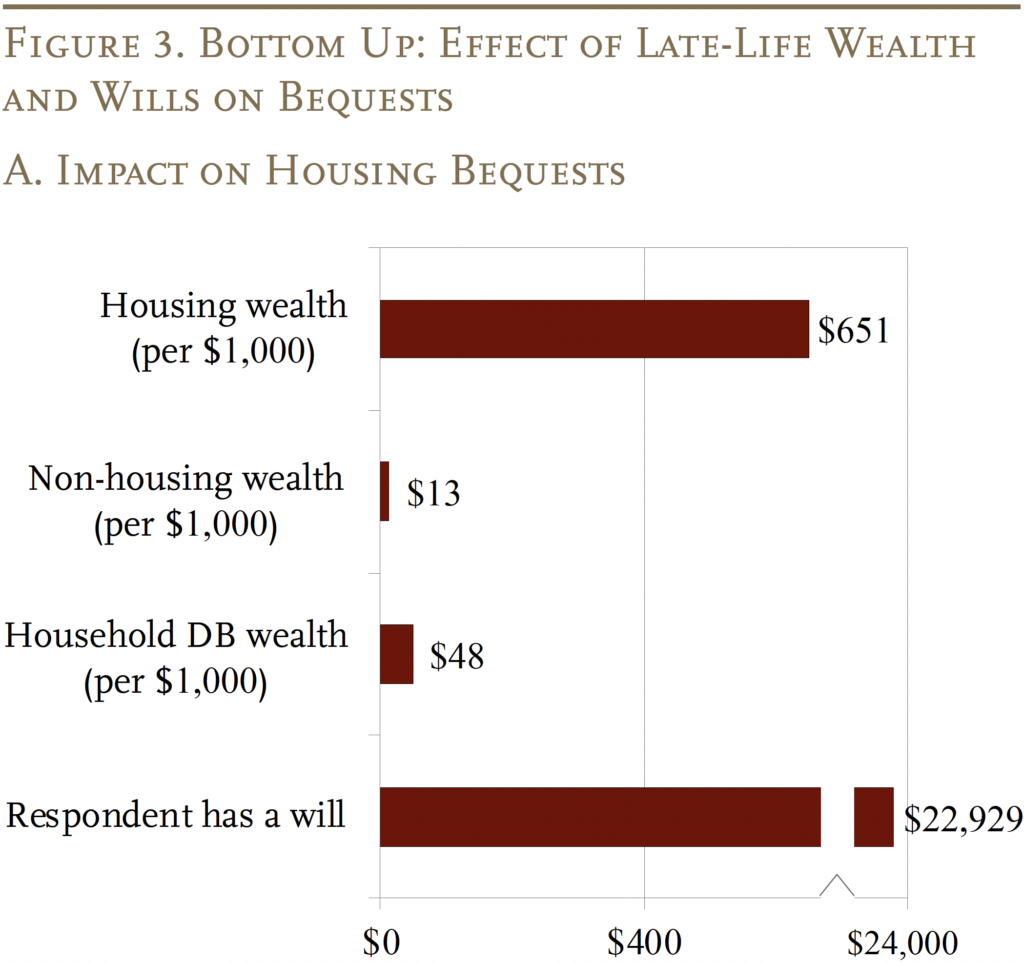
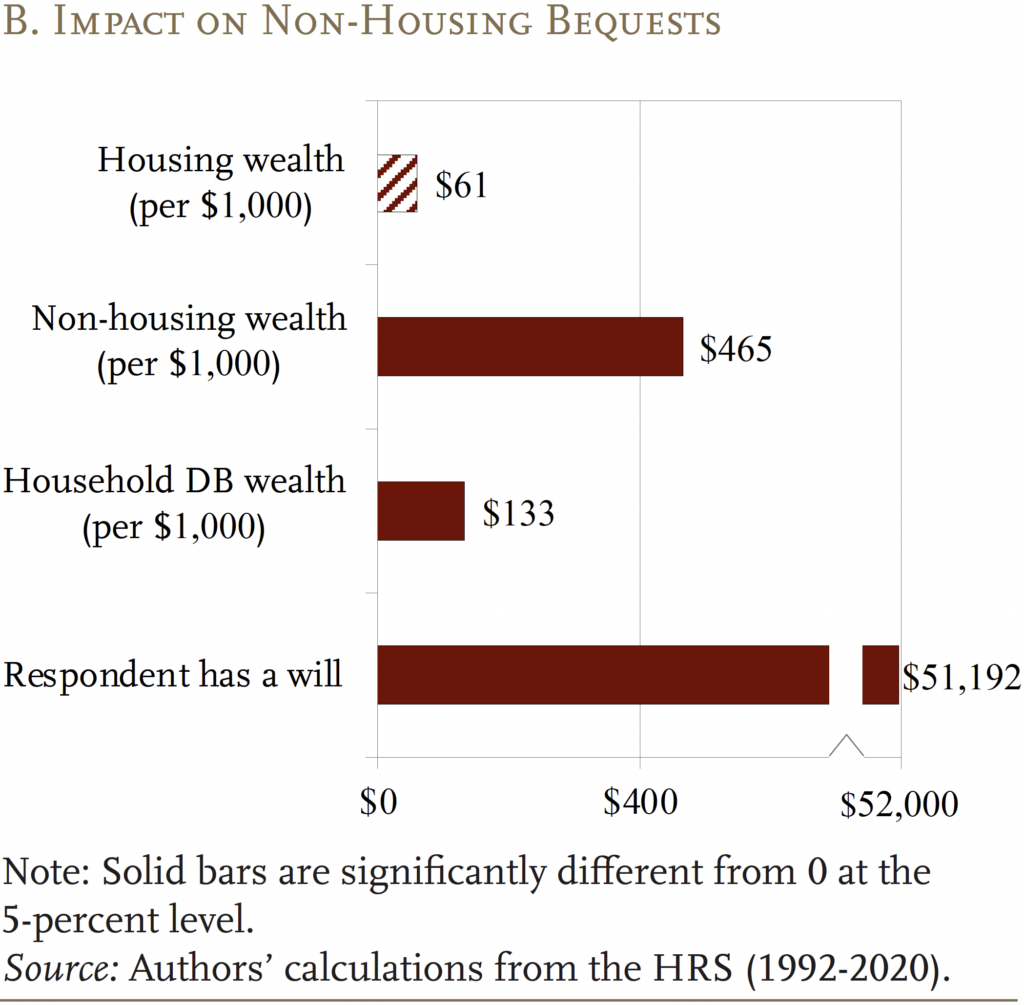
As with the top-down approach, the results show that, holding all else equal, having a will is strongly related to the value of the decedent’s estate, both in terms of housing and non-housing wealth. A decedent with a will leaves, on average, $22,929 more housing wealth and $51,192 more non-housing wealth.
With these estimates in hand, Table 2 summarizes the impact of bringing the will-writing rate for Black households up to that of their White counterparts. (The complete step-by-step exercise is available in the full paper.) Generation 0 is identical to the starting generation in the top-down approach, but the bottom-up approach anticipates greater racial wealth inequality. In terms of how equalizing will-writing in 1980 would have affected the racial wealth gap, again the results show that this change would have had a meaningful impact. By the third generation, the model predicts that the White-Black wealth ratio would be 3.06 with actual will-writing rates, and only 2.81 with racially equal rates. That is, equalizing will-writing in 1980 would have reduced the ratio by about 10 percent.
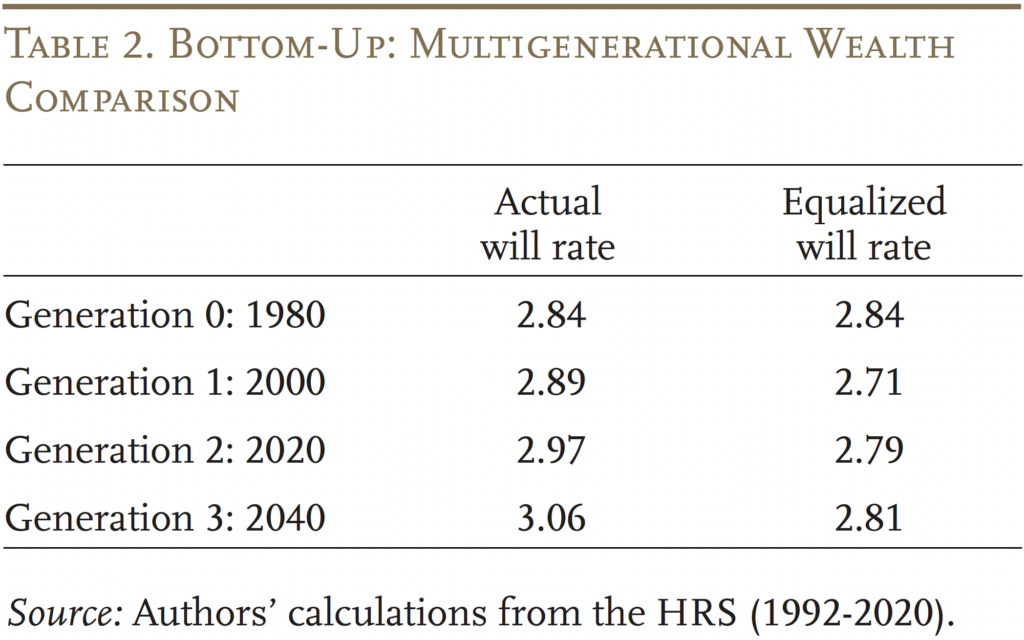
This 10-percent estimate is remarkably similar to the top-down approach, despite a substantially different model. The similarity in the results across the two approaches demonstrates the robustness of the results. This robustness inspires confidence that increasing will-writing among Black households could provide a modest but meaningful contribution to narrowing racial wealth gaps.
Conclusion
The racial wealth gap has proven to be a persistent problem, and one reason may be that Black decedents have a much lower likelihood of having a will. This brief explores how the racial wealth gap might have evolved since 1980 had will-writing rates been equal for Black and White households. The robust finding is that such a change would have modestly but meaningfully reduced the wealth gap – by about 10 percent – by the time today’s prime-age workers reach their peak wealth years (ages 60-70) in 2040. While no one change is likely to completely close the racial wealth gap, interventions that increase the will-writing of Black households are one promising avenue for policy exploration.
References
Angrisani, Marco, Michael Hurd, and Susann Rohwedder. 2019. “The Effect of Housing Wealth Losses on Spending in the Great Recession.” Economic Inquiry 57(2): 972-996.
Aubry, Jean-Pierre, Alicia H. Munnell, and Gal Wettstein. 2023. “Wills, Wealth, and Race.” Working Paper 2023-10. Chestnut Hill, MA: Center for Retirement Research at Boston College.
Aubry, Jean-Pierre, Alicia H. Munnell, Gal Wettstein, and Oliver Shih. 2024. “How Much Could Will-Writing Reduce the Racial Wealth Gap?” Working Paper 2024-16. Chestnut Hill, MA: Center for Retirement Research at Boston College.
Choi, Shinae L., Ian M. McDonough, Minjung Kim, and Giyeom Kim. 2019. “Estate Planning Among Older Americans: The Moderating Role of Race and Ethnicity.” Financial Planning Review 2(3-4): e1058.
Derenoncourt, Ellora, Chi Hyun Kim, Moritz Kuhn, and Moritz Schularick. 2024. “Wealth of Two Nations: The U.S. Racial Wealth Gap, 1860-2020.” The Quarterly Journal of Economics 139(2): 693-750.
Diamond, Rebecca and William F. Diamond. 2024. “Racial Differences in the Total Rate of Return on Owner-Occupied Housing.” Working Paper 32916. Cambridge, MA: National Bureau of Economic Research.
Jordà, Óscar, Katharina Knoll, Dmitry Kuvshinov, Moritz Schularick, and Alan M. Taylor. 2019. “The Rate of Return on Everything, 1870-2015.” The Quarterly Journal of Economics 134(3): 1225-1298.
Kaplan, Greg and Giovanni L. Violante. 2022. “The Marginal Propensity to Consumer in Heterogeneous Agent Models.” Working Paper 30013. Cambridge, MA: National Bureau of Economic Research.
Kermani, Amir and Francis Wong. 2021. “Racial Disparities in Housing Returns.” Working Paper 29306. Cambridge, MA: National Bureau of Economic Research.
Kuhn, Moritz, Moritz Schularick, and Ulrike I. Steins. 2020. “Income and Wealth Inequality in America, 1949-2016.” Journal of Political Economy 128(9): 3469-3519.
Liu, Siyan and Laura D. Quinby. 2023. “What Drives the Racial Housing Wealth Gap for Older Homeowners?” Working Paper 2023-3. Chestnut Hill, MA: Center for Retirement Research at Boston College.
Munnell, Alicia H. and Annika Sundén (eds). 2003. Death and Dollars. Washington, DC: The Brookings Institution.
Munnell, Alicia H., Geoffrey M.B. Tootell, Lynn E. Browne, and James McEneaney. 1996. “Mortgage Lending in Boston: Interpreting HMDA Data.” The American Economic Review 86(1): 25-53.
Sabelhaus, John and Jeffrey P. Thompson. 2022. “Racial Wealth Disparities: Reconsidering the Roles of Human Capital and Inheritance.” Working Paper 22-3. Boston, MA: Federal Reserve Bank of Boston.
Strand, Palma Joy. 2010. “Inheriting Inequality: Wealth, Race and the Laws of Succession.” Oregon Law Review 89: 453-504.
University of Michigan. Health and Retirement Study, 1992-2020. Ann Arbor, MI.
U.S. Social Security Administration. 2024. “Retirement & Survivors Benefits: Life Expectancy Calculator.” Washington, DC.
Wright, Danaya C. 2020. “The Demographics of Intergenerational Transmission of Wealth: An Empirical Study of Testacy and Intestacy on Family Property.” University of Missouri-Kansas City Law Review 88(3): 665-710.
Endnotes
- Aubry et al. (2024). ↩︎
- Derenoncourt et al. (2024). ↩︎
- Derenoncourt et al. (2024). ↩︎
- See Jordà et al. (2019) and Kuhn, Schularick, and Steins (2020). ↩︎
- Differences in location are in part due to discrimination and less access to mortgage loans; see Munnell et al. (1996) and Liu and Quinby (2023). For a discussion of differences in foreclosure rates, see Kermani and Wong (2021). Interestingly, recent work suggests that Black households earn a higher return on housing investment when rental yields are accounted for. See Diamond and Diamond (2024). ↩︎
- See Aubry, Munnell, and Wettstein (2023). ↩︎
- See Munnell and Sundén (2003); Sabelhaus and Thompson (2022); and Aubry, Munnell, and Wettstein (2023). ↩︎
- See Aubry, Munnell, and Wettstein (2023). ↩︎
- See, for example, Strand (2010) and Wright (2020). ↩︎
- See Choi et al. (2019) and Aubry, Munnell, and Wettstein (2023). ↩︎
- See Aubry, Munnell, and Wettstein (2023). ↩︎
- Since the HRS began in 1992, the 1980 wealth values were extrapolated from 1992 using the average annual nominal growth rate for Black and White investors in the HRS from 1992 to 2020. ↩︎
- See Angrisani, Hurd, and Rohwedder (2019) and Kaplan and Violante (2022). These marginal propensities to consume (MPCs) are assumed to be the same across race as are rates of return on assets. While this assumption is counterfactual, it guarantees that differences in MPCs and returns are not driven by the different will-writing rates across race, as hypothesized in the background section. ↩︎
- Based on estimates from the HRS. This age is calculated using all respondents from all waves by the first wave each respondent reported a non-zero inheritance. ↩︎
- In 2024, a 58-year old is expected to live until age 82.9; however life expectancy was lower for prior cohorts (U.S. Social Security Administration 2024). ↩︎
- Also, as one might expect, the cross-mode correlations of bequests and wealth are substantially weaker, with housing wealth having an insignificant association with non-housing bequests and non-housing wealth having only a very small association with housing bequests. ↩︎


