
The National Retirement Risk Index: An Update from the 2022 SCF

The brief’s key findings are:
- From 2019 to 2022, the National Retirement Risk Index improved substantially, dropping from 47 percent to 39 percent.
- Weathering the pandemic turmoil, households were buoyed by government stimulus, strong employment, and rising asset markets.
- The single biggest factor driving the improvement was soaring home values.
- Though these results are encouraging, most people do not tap their home equity in retirement and prices may not stay at such high levels.
- Importantly, even with what may be a temporary improvement, the NRRI shows that 2 in 5 of today’s working households could fall short.
Introduction
The release of the Federal Reserve’s 2022 Survey of Consumer Finances offers an opportunity to reassess Americans’ retirement preparedness as measured by the National Retirement Risk Index (NRRI). The NRRI estimates the share of American households that are at risk of being unable to maintain their pre-retirement standard of living in retirement.
The NRRI was originally constructed using the Federal Reserve’s 2004 Survey of Consumer Finances (SCF) and has been updated every three years with the release of this triennial survey. Since the last SCF was conducted in 2019, the nation experienced a global pandemic and economic disruption, and 2022 was a very bad year for stock and bond returns. These factors would have reduced households’ retirement preparedness. At the same time, the government provided unprecedented fiscal support, employment remained strong, home values rose substantially, and the stock market – even with the drop in 2022 – ended up significantly higher than in 2019. The 2022 survey allows us to see how these disparate factors have affected Americans’ readiness for retirement.
The discussion proceeds as follows. The first section describes the nuts and bolts of the NRRI. The second section updates the NRRI using 2022 SCF data and shows that the share of households at risk dropped from 47 percent to 39 percent, the lowest level since we started the Index in 2004, largely due to rising home values. The third section relates the various reasons for the decline to relevant subgroups. The fourth assesses the implications of the big drop in the NRRI for the future. The final section concludes that, even with the immediate impact of the strong housing market, retirement readiness remains a major challenge for many of today’s workers.
Nuts and Bolts of the NRRI
Constructing the NRRI involves three steps: 1) projecting a replacement rate – retirement income as a share of pre-retirement income – for a nationally representative sample of U.S. households; 2) constructing a target replacement rate consistent with maintaining a pre-retirement standard of living in retirement; and 3) comparing the projected and target replacement rates to find the percentage of households “at risk.”1Target rates are calculated using a lifecycle model rather than a household’s actual, but unobserved, consumption history. For details, see Yin, Chen, and Munnell (2023a,b).
Projecting Household Replacement Rates
The exercise starts with projecting retirement income for households at three retirement ages – 62 for low income, 66 for middle income, and 67 for high income.2The original NRRI assumed that all households stopped working and claimed Social Security benefits at the same age – namely, 65. SCF data on the claiming age for the household head, however, suggest that more reasonable claiming ages for the three income groups would be 62, 66, and 67 for low, middle, and high income respectively. Varying claiming ages by income group incorporates about two-thirds of the total earnings of workers 62-75. While allowing for differential claiming across income groups increases the share of low-income households at risk and decreases the share of high-income households at risk, it does not change the overall percentage of households at risk. For an overview of other methodological improvements to the NRRI, see the Appendix. Retirement income is defined broadly to include income from Social Security and defined benefit (DB) plans; income from financial assets in both defined contribution (DC) plans and saved directly; and income from housing.
The values for financial and housing assets at retirement are calculated from the ratio of wealth to income by age from the 1983-2022 SCFs. As shown in Figure 1, the aggregate wealth-to-income by age has been stable over time, in the sense that the lines rested roughly on top of each other. Similar stability holds with regard to the various components of wealth. Using the stable relationship between each component and income, the analysis estimates DC assets, non-DC financial assets, and housing equity separately, at various retirement ages.
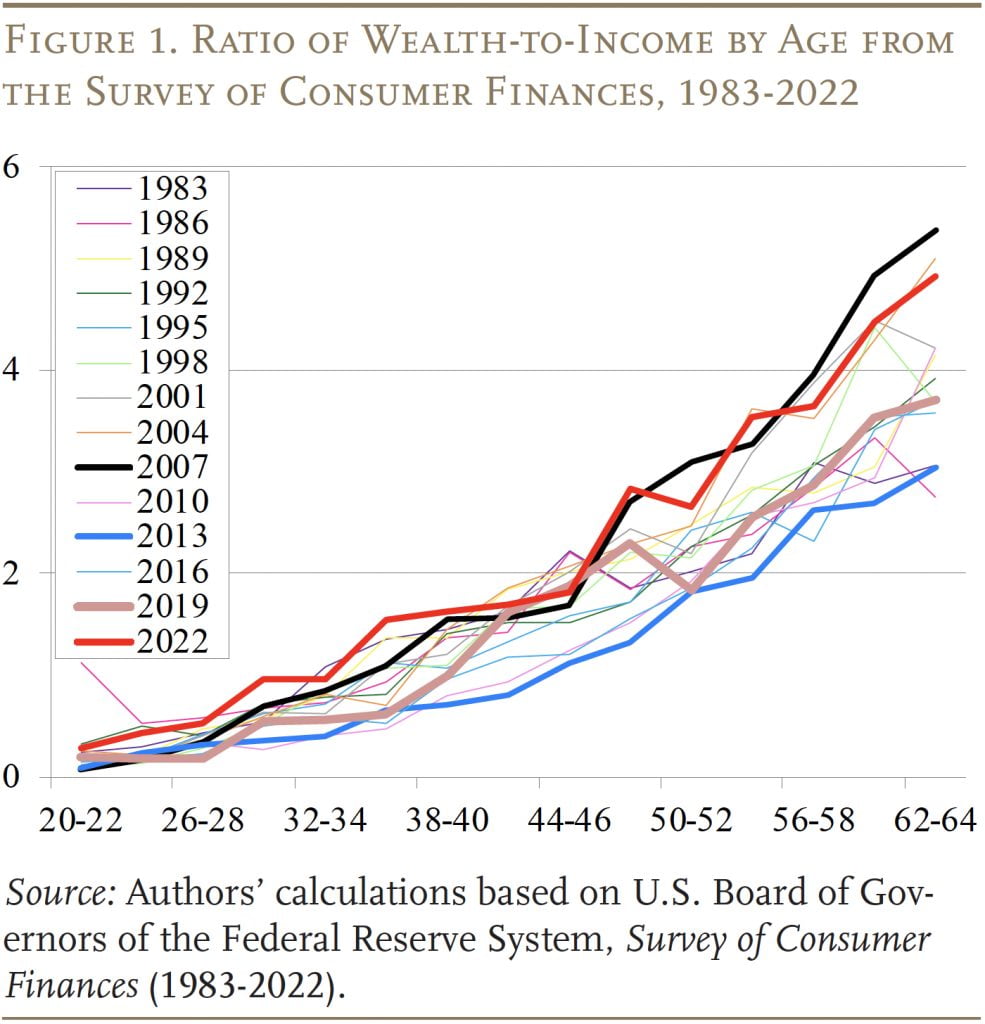
The aggregate wealth-to-income ratios also provide some hint of the NRRI for 2022. Historically, wealth-to-income lines from each survey have been bracketed by 2007 values on the high side and 2013 values on the low side. The 2022 line (red) looks similar to wealth-to-income ratios in 2007, suggesting strong improvements in the percentage of households at risk between 2019 and 2022.
The NRRI calculations assume that households convert all their assets, including financial assets, 401(k)/ IRA balances, and proceeds from a reverse mortgage, into a stream of income by purchasing an inflation-indexed annuity.3While inflation-indexed annuities are not widely used by – or even available to – consumers, they provide a convenient metric for calculating the lifetime income that can be obtained from a lump sum. And while inflation-indexed annuities provide a smaller initial benefit than nominal annuities, they protect a household’s purchasing power over time against the erosive effects of inflation.
Sources of retirement income that are not derived from reported wealth in the SCF are estimated directly. Specifically, Social Security benefits are calculated based on estimated earnings histories for each member of the household, indexed to national average wage growth. DB pension income is based on the amount reported by survey respondents.
The remaining step is to calculate pre-retirement income at the three retirement ages. For homeowners, this measure includes earnings (again, indexed to average wage growth) and imputed rent from housing. Average pre-retirement income then serves as the denominator for each household’s replacement rate. This measure excludes income from assets.
Estimating Target Replacement Rates
Determining the estimated share of the population that is at risk requires comparing projected replacement rates with a benchmark rate. A commonly used benchmark is the replacement rate needed to allow households to maintain their pre-retirement standard of living in retirement. People typically need less than their full pre-retirement income to maintain this standard once they stop working since they generally pay less in taxes, no longer need to save for retirement, and often have paid off their mortgage. Thus, a greater share of their income is available for spending.4The level of replacement required for smoothing consumption before and after retirement will vary by type of household. For example, low-income households get most of their retirement income from Social Security and therefore need little saving before retirement. The result is that they get little break from no longer having to save in retirement. Similarly, low-income households pay little in taxes, so they receive little in the way of tax saving in retirement. Thus, low-income households need a higher replacement rate in retirement. The Index estimates the target replacement rates for different types of households using a consumption-smoothing model, which is based on the assumption that households want the same level of consumption in retirement as they had before they retired.
Calculating the Index
The final step in creating the NRRI is to compare each household’s projected replacement rate with the appropriate target. Households whose projected replacement rates fall more than 10 percent below their targets are deemed to be at risk of having insufficient income to maintain their pre-retirement standard of living. The NRRI is simply the percentage of all households that fall more than 10 percent short of their target.
The NRRI in 2022
The strong ratio of wealth to income shown in Figure 1 suggested that the NRRI would improve in 2022 – that is, fewer households would be at risk. And indeed, the share of households at risk dropped from 47 percent to 39 percent – the lowest level since the Index started in 2004 (see Figure 2).
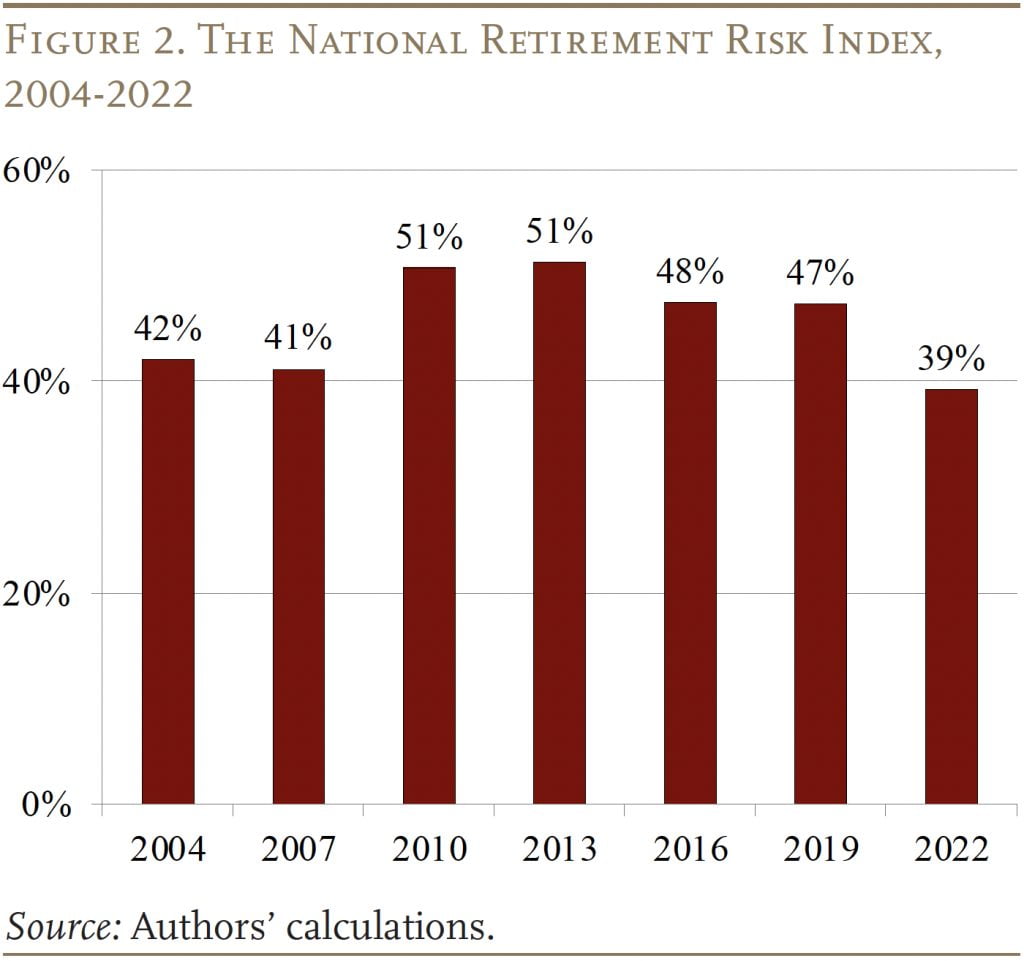
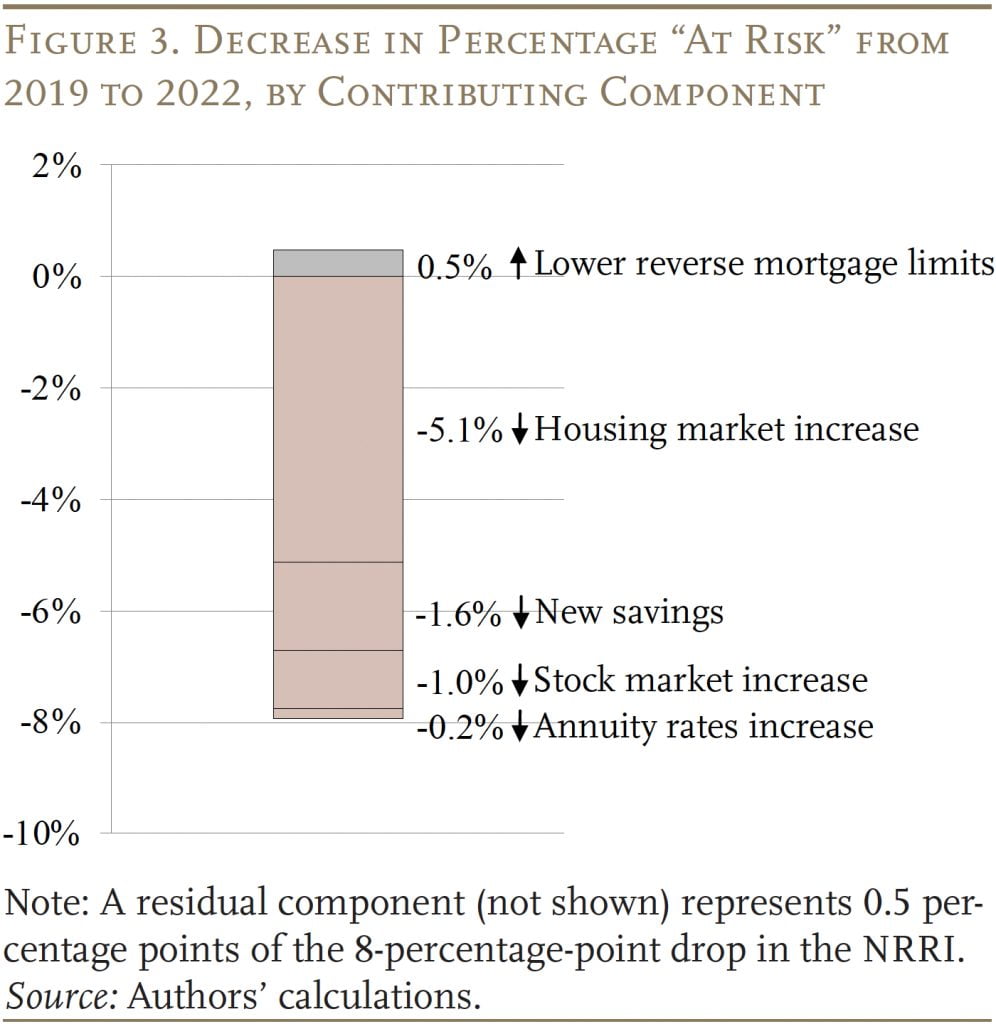
Figure 3 breaks down the reasons for the big reduction in the NRRI. The increase in home prices leads the list, followed by new savings during the pandemic, and stock market gains. Rising interest rates had small offsetting effects. The following takes a closer look at each component.
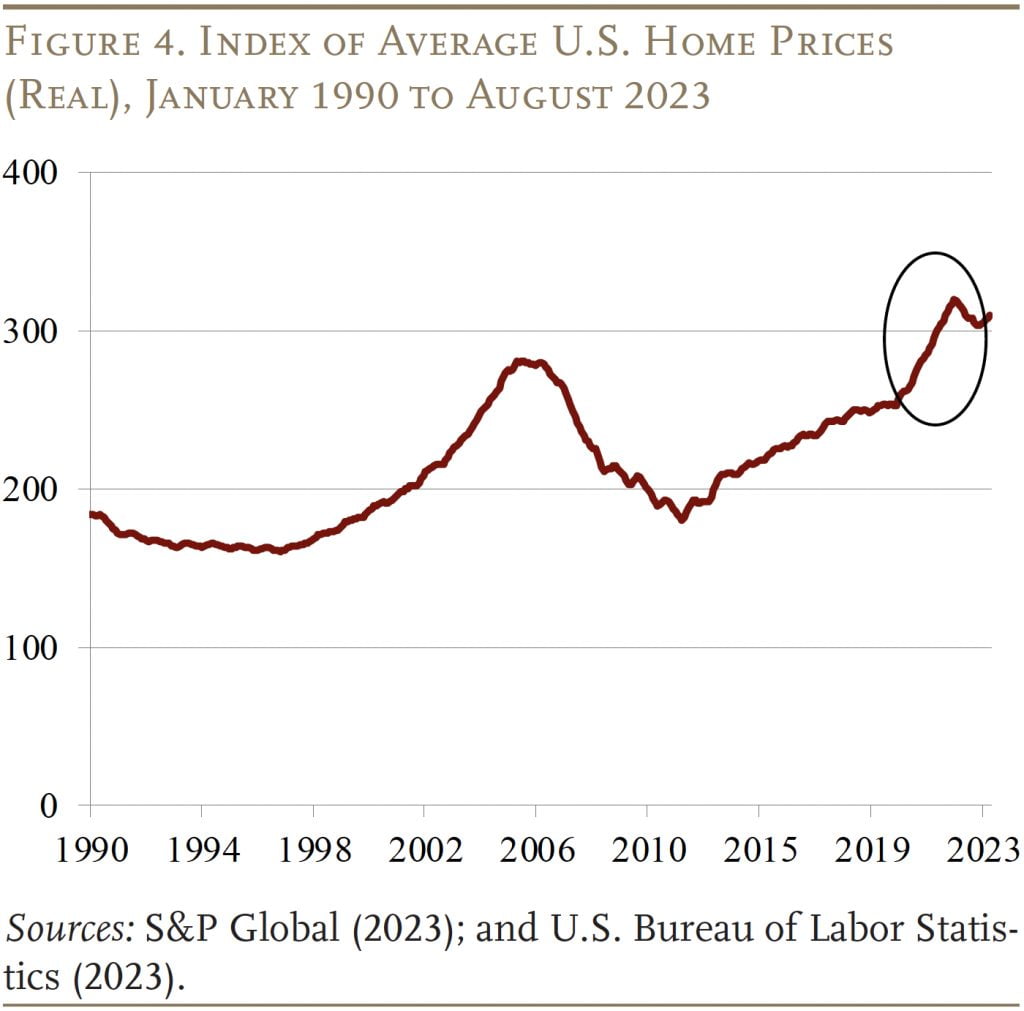
Housing. Between 2019 and 2022, U.S. home prices increased by about 22 percent in real terms, (see Figure 4). For context, home prices grew by 27 percent between 2001 and 2004. In the NRRI, home prices have a significant impact because households are assumed to access their home equity at retirement by taking out a reverse mortgage. The higher the home value, the more equity households can extract through a reverse mortgage.
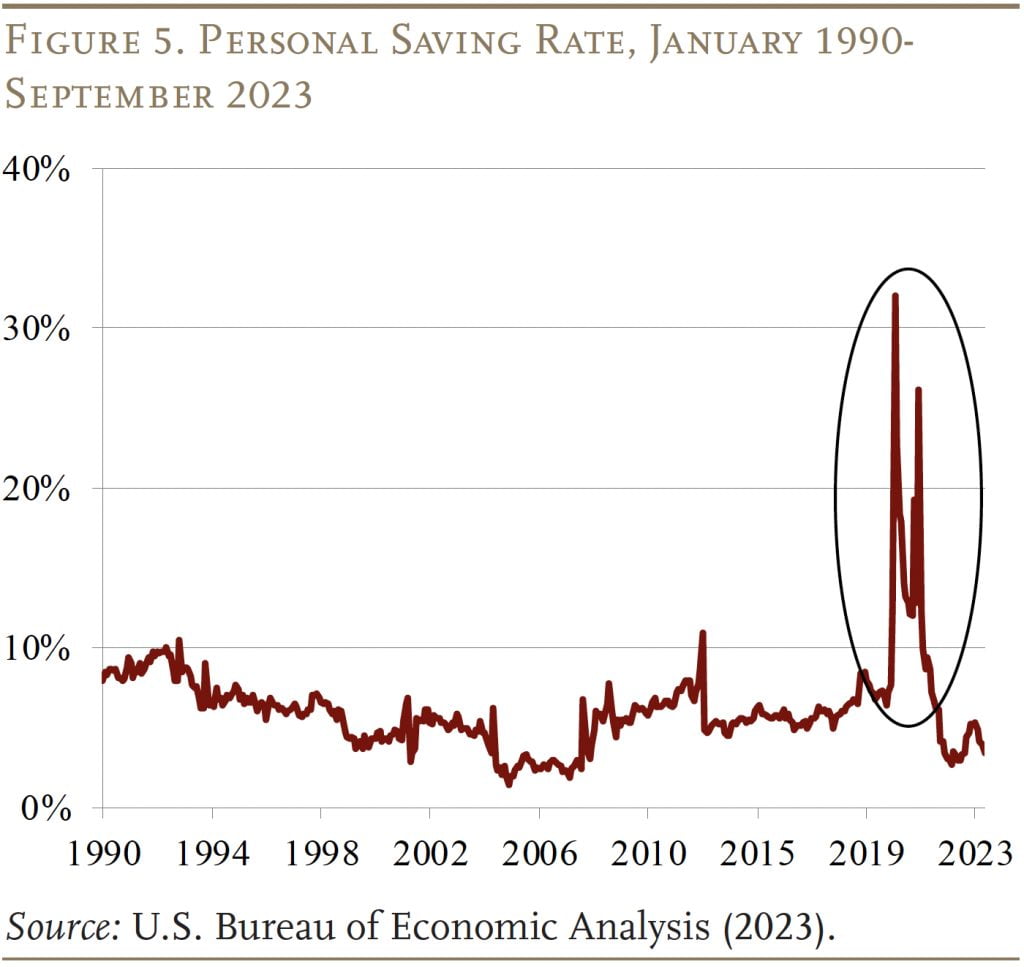
Increased Savings. A unique factor that improved projected retirement finances for many households was a dramatic spike in personal saving during the pandemic, fueled by the federal stimulus spending. Personal saving rates jumped from roughly 7 percent of disposable income to over 30 percent during the pandemic (see Figure 5). While the saving rate returned to pre-pandemic levels by 2022, the build-up in savings in 2020 and 2021 temporarily made many households’ balance sheets much stronger.
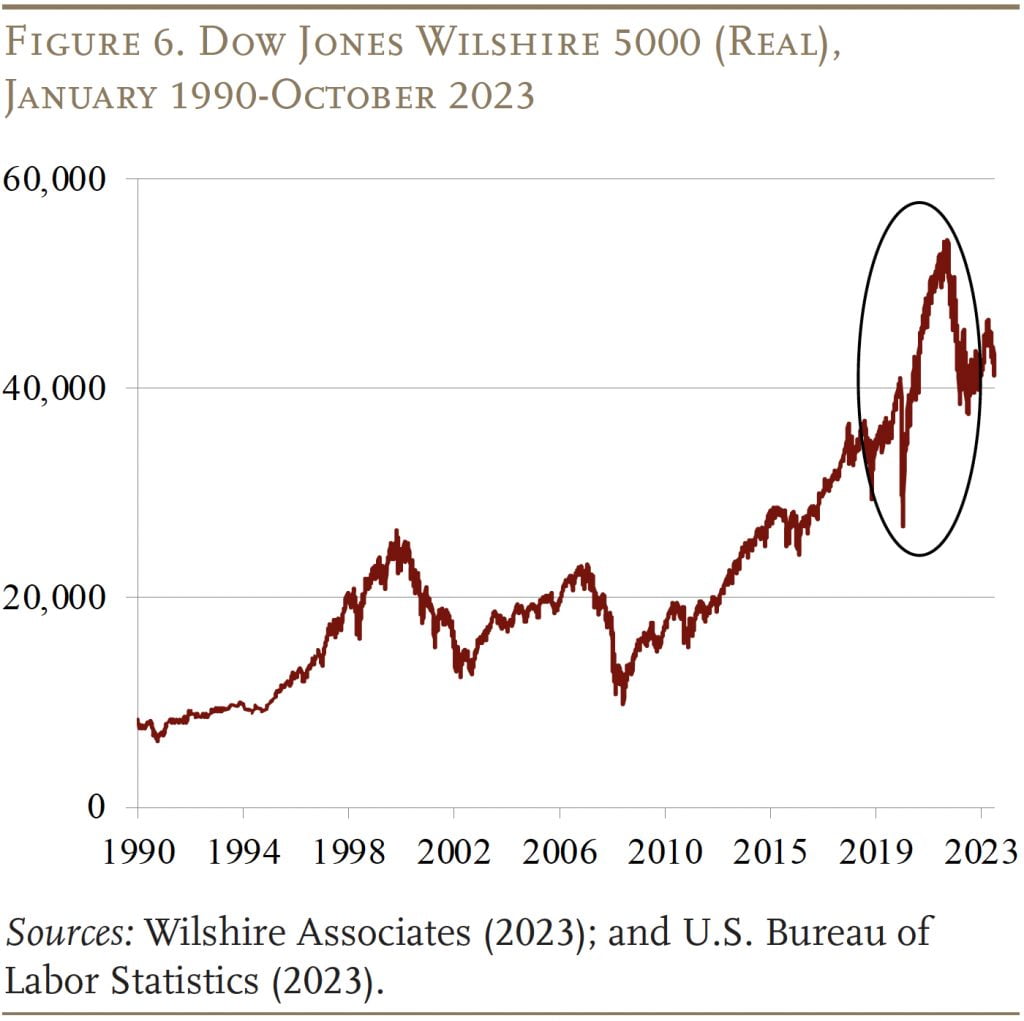
Stock Market. Despite the initial dip early in the pandemic and a pullback in 2022, equity prices increased by more than 20 percent after adjusting for inflation since the end of 2019 (see Figure 6). These gains, however, have been concentrated in the top third of the income distribution, which holds about 87 percent of all equities.5This metric includes equities in retirement accounts. If only equities in brokerage and individual investment accounts were considered, the number would be much higher. This pattern means that much of the gains went to households that were already not at risk.
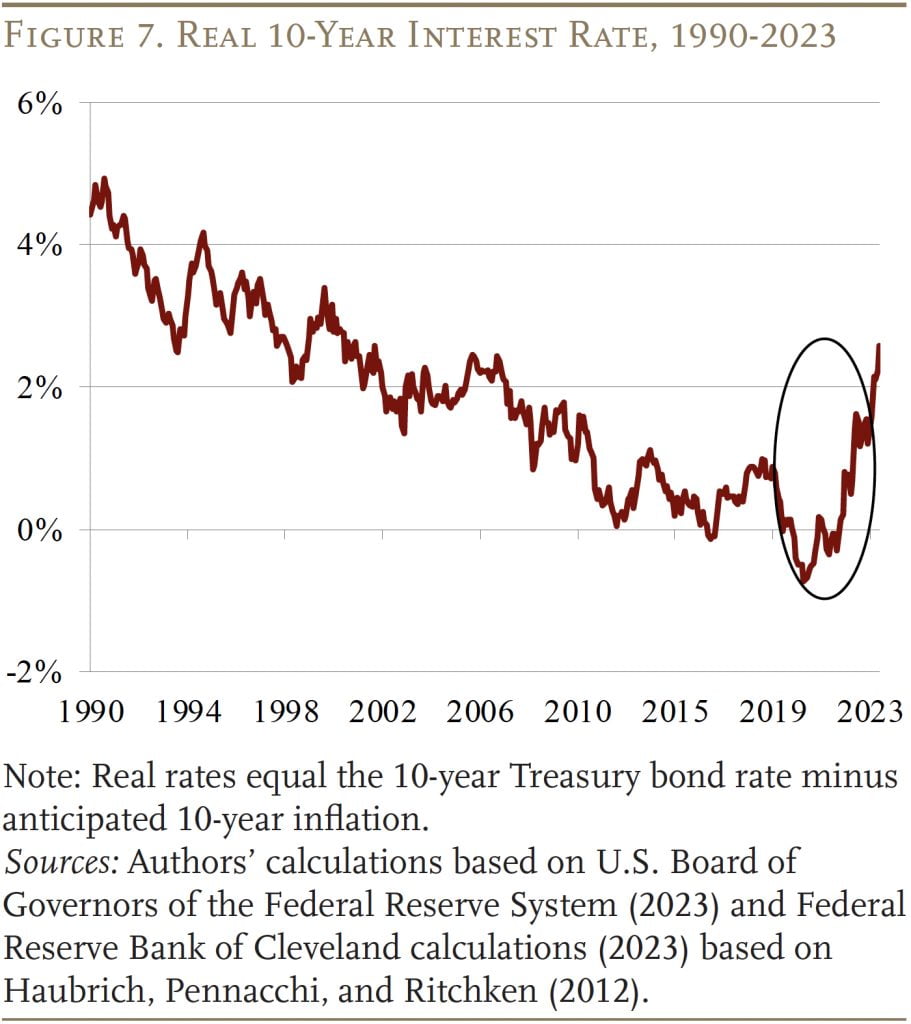
Interest Rates. While real interest rates had been declining for the last 30 years, during the pandemic they spiked to the highest level since the early-2000s (see Figure 7). Higher interest rates have two opposing effects on households’ financial security in retirement. On one hand, higher rates mean that households get more income from annuitizing their assets. On the other hand, the high rates reduce the amount households can get from a reverse mortgage. On net, higher rates increased the percentage of households at risk, but the effect is small.6The NRRI tapers the effect of interest rate fluctuations because it assumes that rates return to their long-run average over time. In other words, households approaching retirement will experience all or part of the change in interest rates while households under age 50 remain at long-run levels.
Impact of 2022 Changes for NRRI Subgroups
Given the importance of the various factors reducing the percentage at risk, it is interesting to examine the patterns in the NRRI by homeownership status, retirement plan coverage, income level, and age group.
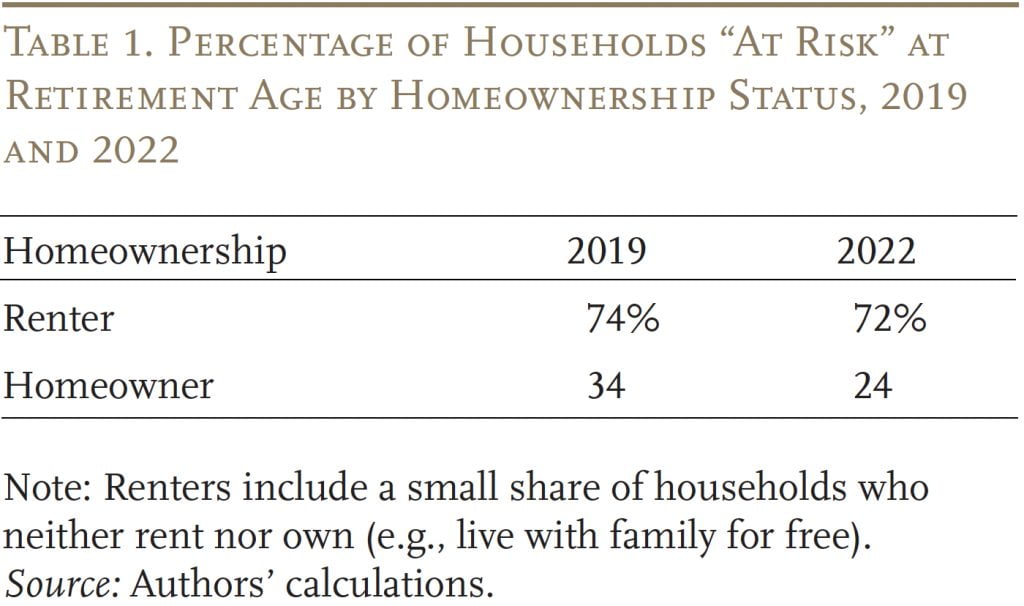
It is not surprising that fewer homeowners are at risk relative to renters, but the gap between the two groups increased. The strong growth in the housing market reduced the share of homeowners at risk by 10 percentage points, while the share of renters at risk stayed fairly steady (see Table 1).
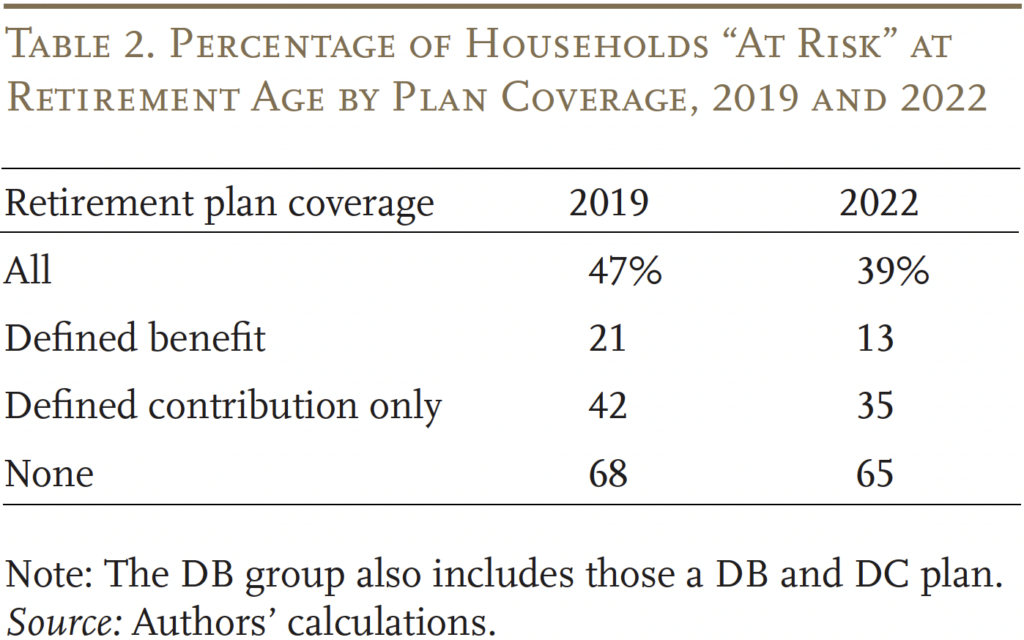
At the same time, the gains in the stock market between 2019 and 2022 reduced the percentage at risk of households with a DC plan, while the percentage at risk with no retirement plan dropped only slightly (see Table 2). The declining NRRI for households with a DB plan reflects the fact that an increasing share of these plans are in the public sector, where pensions are a major component of total compensation.
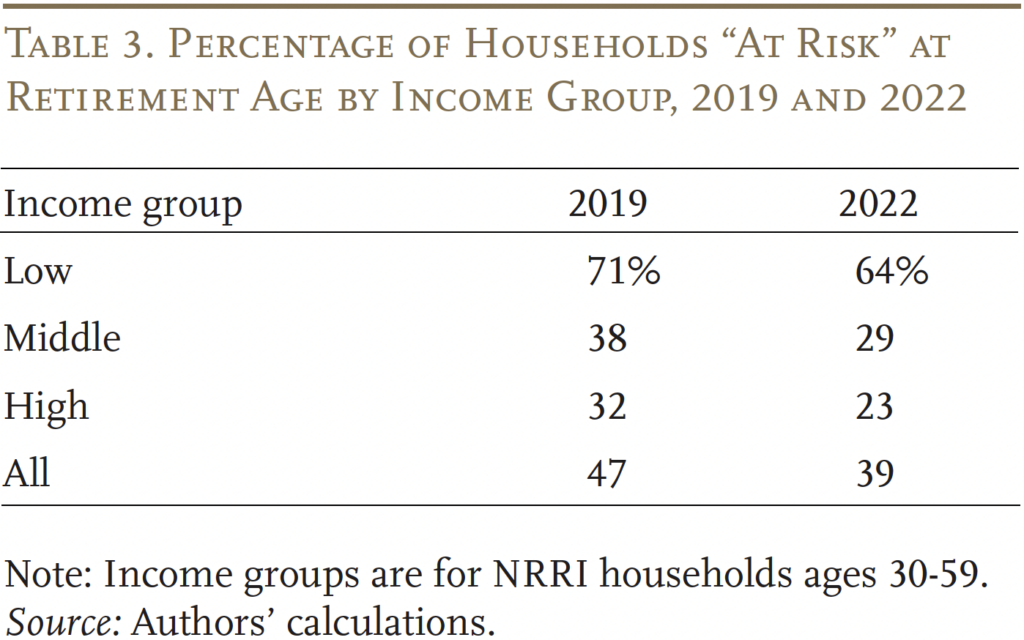
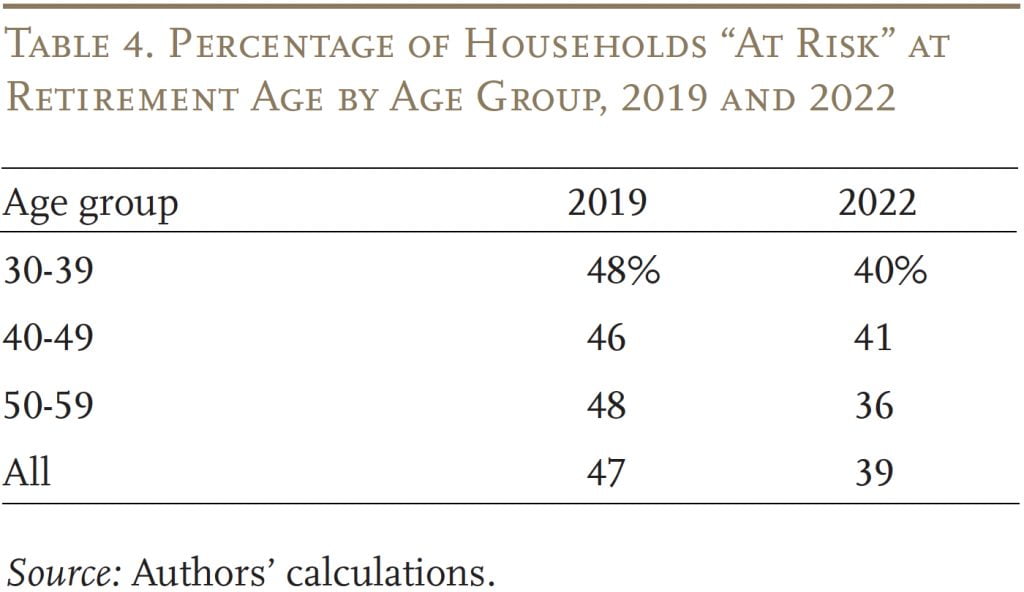
When viewed by income and age, the largest gains in relative terms were enjoyed by high-income households (see Table 3), who are mostly likely to own homes and who hold most of the equities. The gains for the low- and middle-income groups most likely reflect some homeownership and perhaps some of the new savings. In terms of age, the oldest group, who hold most of the assets, saw the largest reduction in the NRRI (see Table 4).
Implications of 2022 NRRI for the Future
The 2022 NRRI represents the biggest drop in the Index since its creation, largely driven by growth in the asset markets, and in particular the housing market. Current housing prices are about 14 percent above their long-run trend for the last 30 years.7At the end of 2022, the inflation-adjusted S&P CoreLogic Case-Shiller U.S. National Home Price Index was at 307.7, 14 percent higher than the predicted index of 270.2 based on a linear trend starting in 1990. It would seem reasonable that, over time, housing prices may revert to trend. Moreover, it is important to remember that the NRRI has retirees purchasing a reverse mortgage – something that few actually do. Therefore, the share of households deemed at risk by the NRRI can be viewed as a lower-bound estimate. In fact, a recent study by researchers at Vanguard found that at least 70 percent of households would fall short of their pre-retirement standard of living in retirement when housing equity is excluded.8Tan et al. (2023).
The other major factor contributing to the decline in the NRRI from 2019 to 2022 that may not persist in the future is “new saving.” Personal saving rates have returned to pre-pandemic levels and so has credit card borrowing. Thus, it appears that households are spending some of the additional savings they built up since 2019.9Although households have spent down some of the new savings accumulated during the pandemic, researchers have found that households across the income distribution have more savings now than they did in 2019 (Wheat and Deadman 2023; Barbiero and Patki 2023). The extent to which households have spent down new savings, however, is not clear (Barbiero and Patki 2023). Thus, one would not expect new savings to be a major contributor to improved retirement readiness over the next three years.
In contrast to these transitory effects, the positive impact of the stock market may be more permanent. As noted, most households saw a rise in net financial wealth and 401(k)/IRA balances due to higher stock prices and the one-time accumulation in new savings.10The exception is households ages 40-49, who saw a decrease in their net financial assets and retirement assets between 2019 and 2022. One explanation could be that these households shifted assets from their financial and retirement accounts to help buy a house. That means, even ignoring growth in the housing market, households across the income and age distribution are more prepared for retirement than they were in 2019. Although always uncertain, stock market gains may well contribute to improving the financial security of middle- and high-income households in the future.
Conclusion
Between 2019 and 2022, the NRRI dropped substantially – from 47 to 39 percent. Despite a global pandemic and economic disruption, household finances were buoyed by unprecedented fiscal support, a strong labor market, and considerable growth in the housing and stock markets. The biggest factor driving the improvement in retirement finances is growth in the housing market. But most households do not tap their home equity in retirement and home prices may not remain at historically high levels. The bottom line is that even a conservative estimate shows a substantial portion – about two-fifths – of today’s households will not have enough retirement income to maintain their pre-retirement standard of living. This analysis continues to confirm that we need to fix our retirement system so that Social Security is financially sound and employer plan coverage is universal.
References
Barbiero, Omar and Dhiren Patki. 2023. “Have US Households Depleted All the Excess Savings They Accumulated during the Pandemic?” Current Policy Perspectives Paper 97263. Boston, MA: Federal Reserve Bank of Boston.
Federal Reserve Bank of Cleveland. 2023. “Ten-Year Expected Inflation and Real and Inflation Risk Premia.” Cleveland, OH.
Haubrich, Joseph, George Pennacchi, and Peter Ritchken. 2012. “Inflation Expectations, Real Rates, and Risk Premia: Evidence from Inflation Swaps.” The Review of Financial Studies 25(5): 1588-1629.
S&P Global. 2023. “S&P CoreLogic Case-Shiller U.S. National Home Price NSA Index.” New York, NY: S&P Dow Jones Indices.
Tan, Fu, Fiona Greig, Andrew S. Clarke, Kevin Khang, Kate McKinnon, and Victoria Zhang. 2023. “The Vanguard Retirement Outlook: A National Perspective on Retirement Readiness.” Valley Forge, PA: Vanguard.
U.S. Board of Governors of the Federal Reserve System. 2023. “Selected Interest Rates: Historical Data.” Washington, DC.
U.S. Board of Governors of the Federal Reserve System. Survey of Consumer Finances, 1983-2022. Washington, DC.
U.S. Bureau of Economic Analysis. 2023. Personal Saving Rate Data (accessed from FRED database). Washington, DC.
U.S. Bureau of Labor Statistics. 2023. Consumer Price Index. Washington, DC.
Wheat, Chris and Erica Deadman. 2023. “Household Pulse: Balances through March 2023.” Washington, DC: JPMorgan Chase Institute.
Wilshire Associates. 2023. “Dow Jones Wilshire 5000 (Full Cap) Price Levels Since Inception.” Santa Monica, CA.
Yin, Yimeng, Anqi Chen, and Alicia H. Munnell. 2023a. “The National Retirement Risk Index with Varying Claiming Ages.” Issue in Brief 23-23. Chestnut Hill, MA: Center for Retirement Research at Boston College.
Yin, Yimeng, Anqi Chen, and Alicia H. Munnell. 2023b. “The National Retirement Risk Index: Version 2.0.” Issue in Brief 23-10. Chestnut Hill, MA: Center for Retirement Research at Boston College.
Appendix: Methodological Improvements in NRRI since 2019
Since its inception, the Center has periodically made modest changes to the NRRI. Recently, however, we undertook a major overhaul to incorporate new research findings and methodological advances.11See Yin, Chen, and Munnell (2023a,b) for details about all the updates. Although the overall modeling framework described above remains unchanged, the updated NRRI includes the following major improvements:
Accounts for differential claiming. One of the biggest and most recent updates in the NRRI is allowing households in different income groups to claim Social Security (and stop working) at different ages. Differential claiming better reflects the real-world choices households make around retirement.
Captures growing wealth inequality. Another major update in the NRRI is shifting from average wealth-to-income ratios to median ratios when projecting wealth. Using medians for our projections allows the model to better capture real-world wealth distributions, particularly given growing wealth inequality.12The previous projection method was based on the mean wealth growth paths estimated by a linear regression approach. The previous methodology imposes restrictions on the resulting projected distributions, which can partially reduce the bias. However, the rise in wealth inequality over time makes it increasingly difficult to rely on this approach.
Better reflects the shift from DB to DC plans. The new method projects DC assets for different cohorts to account for the growing share of younger workers covered by DC plans.13The growing share of workers covered by DC plans since the 1980s means that the level and pattern of DC asset accumulation differs across birth cohorts. To account for differences in access to DC plans and accumulation, the improved method projects DC assets separately for three broad cohorts: 1) workers born before 1945, who were at least halfway into their careers when coverage under DC plans began to expand in 1980; 2) workers born from 1945-1955, who were early in their careers during the transition to DC plans; and 3) workers born after 1955, whose careers mostly fall in the years when DC plans were already prevalent.
Models financial debt separately. Financial assets and non-mortgage debt are now projected separately instead of in a single net financial asset variable.14Analyses of previous NRRI results suggest that the dynamics of financial debt can be of interest on their own. For example, middle-age and middle-income households saw very limited improvements in retirement preparedness in 2016 partly due to increased non-mortgage borrowing. The new method now projects financial assets and non-mortgage debt separately, allowing for more in-depth analysis as well as counterfactual analysis focusing on borrowing.
Refines the target replacement rate model. Projected replacement rates are matched to a wide range of characteristics, allowing for hundreds of targets, instead of just 12 household types in the previous model.15Under the new method, much richer household characteristics are used for calculating target rates, allowing the projected replacement rates to be matched to hundreds of targets, which yields more accurate estimates. Specifically, matching is now based on much more fine-grained income groups and households’ actual DB coverage and homeownership status.
Endnotes
- 1Target rates are calculated using a lifecycle model rather than a household’s actual, but unobserved, consumption history. For details, see Yin, Chen, and Munnell (2023a,b).
- 2The original NRRI assumed that all households stopped working and claimed Social Security benefits at the same age – namely, 65. SCF data on the claiming age for the household head, however, suggest that more reasonable claiming ages for the three income groups would be 62, 66, and 67 for low, middle, and high income respectively. Varying claiming ages by income group incorporates about two-thirds of the total earnings of workers 62-75. While allowing for differential claiming across income groups increases the share of low-income households at risk and decreases the share of high-income households at risk, it does not change the overall percentage of households at risk. For an overview of other methodological improvements to the NRRI, see the Appendix.
- 3While inflation-indexed annuities are not widely used by – or even available to – consumers, they provide a convenient metric for calculating the lifetime income that can be obtained from a lump sum. And while inflation-indexed annuities provide a smaller initial benefit than nominal annuities, they protect a household’s purchasing power over time against the erosive effects of inflation.
- 4The level of replacement required for smoothing consumption before and after retirement will vary by type of household. For example, low-income households get most of their retirement income from Social Security and therefore need little saving before retirement. The result is that they get little break from no longer having to save in retirement. Similarly, low-income households pay little in taxes, so they receive little in the way of tax saving in retirement. Thus, low-income households need a higher replacement rate in retirement.
- 5This metric includes equities in retirement accounts. If only equities in brokerage and individual investment accounts were considered, the number would be much higher.
- 6The NRRI tapers the effect of interest rate fluctuations because it assumes that rates return to their long-run average over time. In other words, households approaching retirement will experience all or part of the change in interest rates while households under age 50 remain at long-run levels.
- 7At the end of 2022, the inflation-adjusted S&P CoreLogic Case-Shiller U.S. National Home Price Index was at 307.7, 14 percent higher than the predicted index of 270.2 based on a linear trend starting in 1990.
- 8Tan et al. (2023).
- 9Although households have spent down some of the new savings accumulated during the pandemic, researchers have found that households across the income distribution have more savings now than they did in 2019 (Wheat and Deadman 2023; Barbiero and Patki 2023). The extent to which households have spent down new savings, however, is not clear (Barbiero and Patki 2023).
- 10The exception is households ages 40-49, who saw a decrease in their net financial assets and retirement assets between 2019 and 2022. One explanation could be that these households shifted assets from their financial and retirement accounts to help buy a house.
- 11See Yin, Chen, and Munnell (2023a,b) for details about all the updates.
- 12The previous projection method was based on the mean wealth growth paths estimated by a linear regression approach. The previous methodology imposes restrictions on the resulting projected distributions, which can partially reduce the bias. However, the rise in wealth inequality over time makes it increasingly difficult to rely on this approach.
- 13The growing share of workers covered by DC plans since the 1980s means that the level and pattern of DC asset accumulation differs across birth cohorts. To account for differences in access to DC plans and accumulation, the improved method projects DC assets separately for three broad cohorts: 1) workers born before 1945, who were at least halfway into their careers when coverage under DC plans began to expand in 1980; 2) workers born from 1945-1955, who were early in their careers during the transition to DC plans; and 3) workers born after 1955, whose careers mostly fall in the years when DC plans were already prevalent.
- 14Analyses of previous NRRI results suggest that the dynamics of financial debt can be of interest on their own. For example, middle-age and middle-income households saw very limited improvements in retirement preparedness in 2016 partly due to increased non-mortgage borrowing. The new method now projects financial assets and non-mortgage debt separately, allowing for more in-depth analysis as well as counterfactual analysis focusing on borrowing.
- 15Under the new method, much richer household characteristics are used for calculating target rates, allowing the projected replacement rates to be matched to hundreds of targets, which yields more accurate estimates. Specifically, matching is now based on much more fine-grained income groups and households’ actual DB coverage and homeownership status.


Yin, Yimeng, Anqi Chen, and Alicia H. Munnell. 2024. "The National Retirement Risk Index: An Update from the 2022 SCF" Issue in Brief 24-5. Chestnut Hill, MA: Center for Retirement Research at Boston College.