
The National Retirement Risk Index with Varying Claiming Ages

The brief’s key findings are:
- Households ages 62-75 have substantial earnings.
- The National Retirement Risk Index, which assumes all households claim Social Security – and retire – at 65, does not count earnings after 65.
- So, about half of all earnings for those 62-75 are excluded from the Index and could distort the results.
- Introducing more realistic claiming ages for low-, middle-, and high-income households solves two problems:
- Increases the earnings in the Index to two-thirds, with the rest going mainly to high earners where it has little impact.
- Produces a more sensible pattern of percentage “at risk” by income group.
- One thing that doesn’t change is the overall percentage of today’s working households at risk: that’s still about 50 percent.
Introduction
The National Retirement Risk Index (NRRI) measures the share of working-age households that will be unable to maintain their pre-retirement standard of living once they retire. The Index is based on data from the Federal Reserve’s Survey of Consumer Finances and compares household projected replacement rates – retirement income as a percentage of pre-retirement income – with target rates. Those households whose projected replacement rate falls more than 10 percent below the target are characterized as being “at risk.”
The NRRI, which has been estimated repeatedly since 2006 and most recently totally revamped, consistently shows that – even if households work to age 65 and annuitize all their financial assets, including the receipts from reverse mortgages on their homes – almost half of households are at risk of being unable to maintain their standard of living.
Despite the consistency of the NRRI, we are always looking for ways to improve the measure. In a review of the revamped NRRI, our favorite colleague and critic – Andrew Biggs of the American Enterprise Institute – argued that a serious flaw with the Index is that it omits a major source of income in retirement – namely, earnings.1Biggs (2023). Indeed, the Index does not include the earnings of older people once they retire, but roughly half of aggregate earnings of those ages 62-75 occur before the assumed retirement age of 65 and therefore are already incorporated in the model as part of wealth accumulation. However, given the importance of the relationship between Social Security claiming ages and the inclusion of earnings, this brief explores the extent to which assuming more realistic claiming ages reduces the “excluded-earnings” problem.
The discussion proceeds as follows. The first section describes the nuts and bolts of the NRRI, as currently constructed. The second section explores the importance of earnings and the relationship between earnings and Social Security claiming age among older households for low-, middle-, and high-income groups. The third section shows that an NRRI that varies claiming ages by income group incorporates about two-thirds of earnings in the model and produces very similar overall results to the original NRRI. The final section concludes that while the existing NRRI produces a good representation of risk for the whole population, an index that varies Social Security claiming ages includes the bulk of earnings by older workers and provides a better picture of outcomes by income group. So those parameters will be used to construct the NRRI going forward.
Nuts and Bolts of the NRRI
The NRRI is constructed with data from the Federal Reserve’s Survey of Consumer Finances (SCF), a triennial nationally representative household survey. Calculating the NRRI involves three steps: 1) projecting a replacement rate – retirement income as a share of pre-retirement income – for each SCF household ages 30-59; 2) constructing a target replacement rate that would allow each household to maintain its pre-retirement standard of living in retirement; and 3) comparing the projected and target rates to find the percentage of households “at risk.”
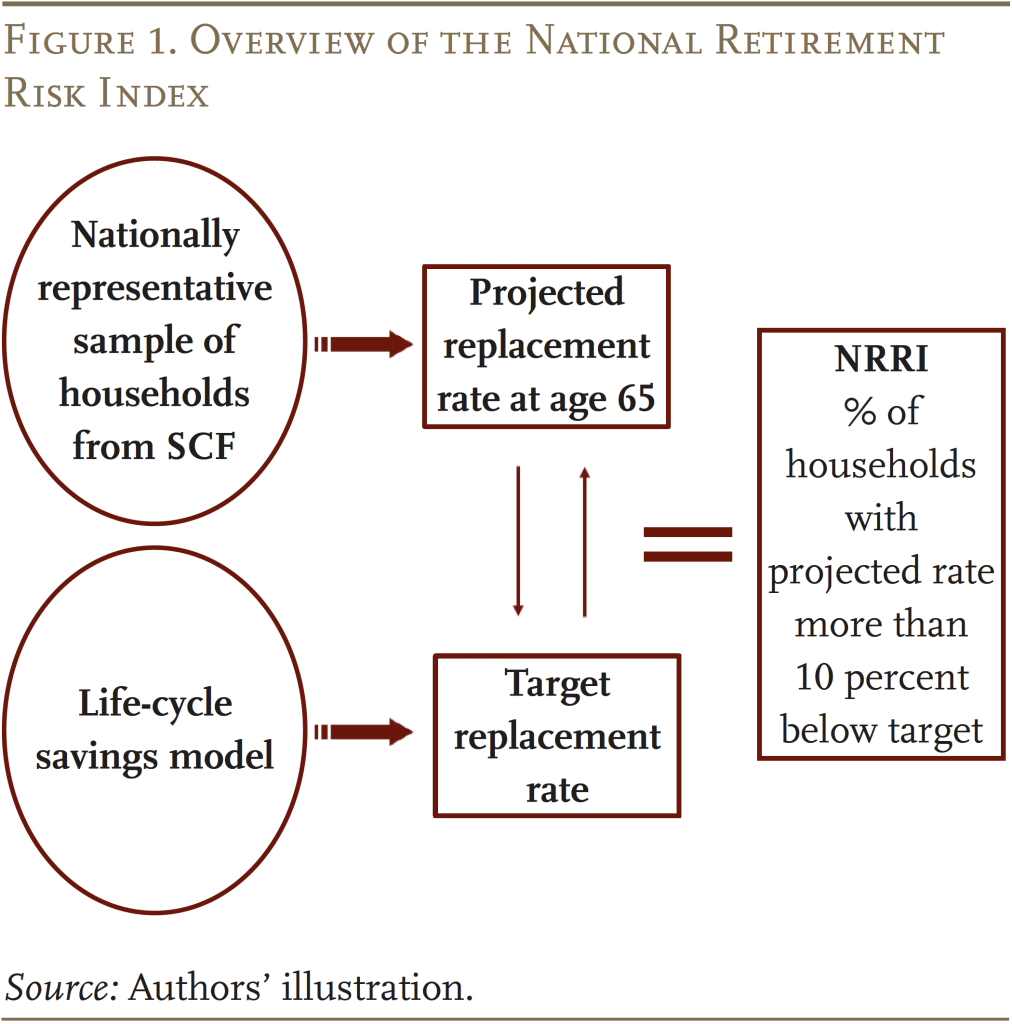
The replacement rate calculation starts with a projection of retirement income, currently at age 65. This measure is defined broadly to include income from Social Security, defined benefit (DB) plans; financial assets both in defined contribution (DC) plans and saved directly; and housing, which includes imputed rent as well as home equity. As noted in the introduction, the NRRI does not include earnings from work, because the focus is retired households and labor force participation declines noticeably after 65.
The values for DC assets, non-DC financial assets, and housing equity are derived from reported wealth in the SCF. They are each projected separately to age 65 based on their respective wealth-to-income ratios by age, which have been remarkably stable over time. The NRRI then assumes that households convert all their assets, including financial assets, 401(k)/IRA balances, and proceeds from a reverse mortgage, into a stream of income by purchasing an inflation-indexed annuity.2While inflation-indexed annuities are not widely used by consumers, they provide a convenient metric for calculating the lifetime income that can be obtained from a lump sum. And while inflation-indexed annuities provide a smaller initial benefit than nominal annuities, they protect a household’s purchasing power over time against the erosive effects of inflation.
Sources of retirement income that are not derived from reported wealth in the SCF are estimated directly. Specifically, Social Security benefits are calculated based on estimated earnings histories for each member of the household, indexed to national average wage growth. DB pension income is based on the amount reported by survey respondents.
The remaining step is to calculate average lifetime income prior to retirement. Pre-retirement income for homeowners includes earnings and imputed rent from housing. Average lifetime income (with earnings, again, indexed to average wage growth) then serves as the denominator for each household’s replacement rate. This measure excludes income from assets.
To determine the share of the population that will be at risk requires comparing projected replacement rates with a benchmark rate. A commonly used benchmark is the replacement rate needed for households to maintain their pre-retirement standard of living in retirement. People typically need less than their full pre-retirement income since they generally pay less in taxes, no longer need to save for retirement, and often have paid off their mortgage. Thus, a greater share of their income is available for spending. The Index estimates the target replacement rates for different types of households using a consumption-smoothing model, which assumes that households want the same level of consumption in retirement as they had before they retired.
The final step is to compare each household’s projected replacement rate with the target from the consumption-smoothing model. Those whose projected replacement rates fall more than 10 percent below the target are deemed to be at risk of having insufficient income to maintain their pre-retirement standard of living. The Index is simply the percentage of all working-age households that fall more than 10 percent short of their targets.
Earnings and Retirement for Households Ages 62-75
The first question at hand is the importance of earnings among households with a head ages 62-75 – a group eligible for Social Security, many of whom could be presumed retired. As shown in Table 1, earnings represent an amazingly high share of total income for these older households – 19 percent for low-income households, 37 percent for the middle-income group, and 55 percent for high-income households. Moreover, a comparison with 1995 reveals that earnings have been a significant component of the income of older households for some time, and have become more important recently. The share increased by 10 percentage points for middle-income households and by 13 percentage points for high-income households. It appears that word has gotten out that working longer is the key to a secure retirement, and those with the most education and resources have changed their behavior.
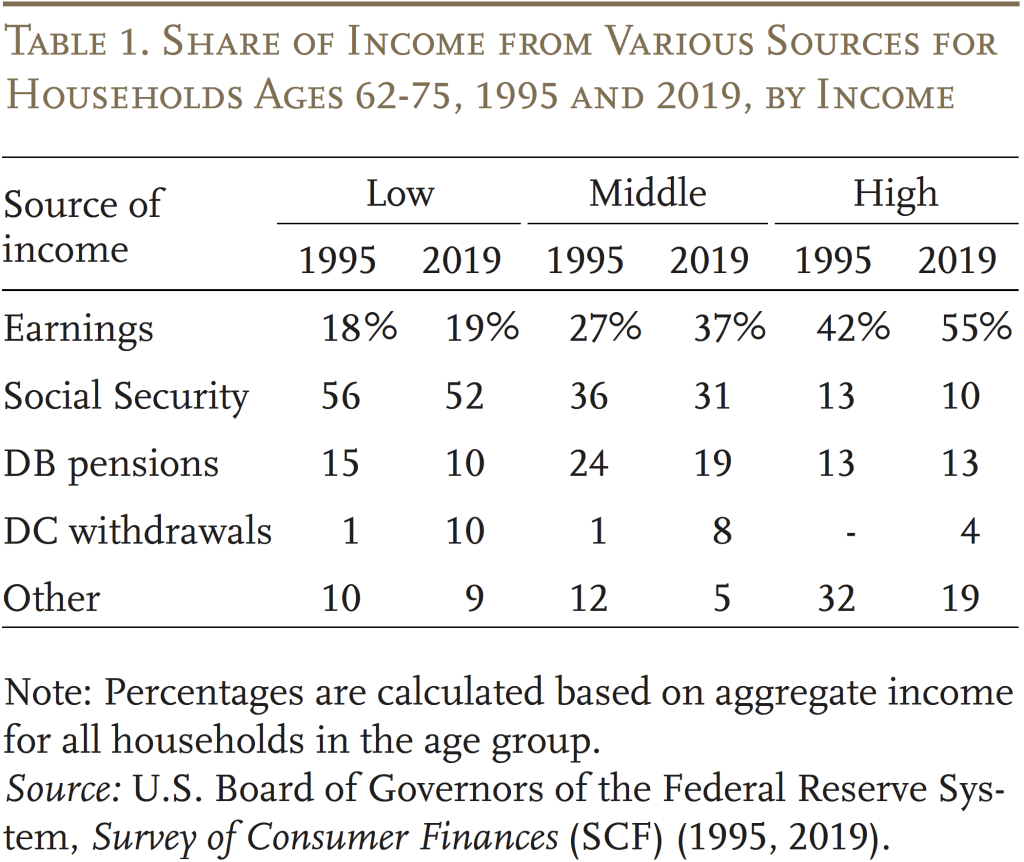
The current Index assumes that all households stop working and claim Social Security benefits at the same age – namely, 65. SCF data on the claiming age for the household head, however, suggest that more reasonable claiming ages for the three groups would be 62, 66, and 67. Varying claiming ages by income group incorporates about two-thirds of the total earnings of workers 62-75.
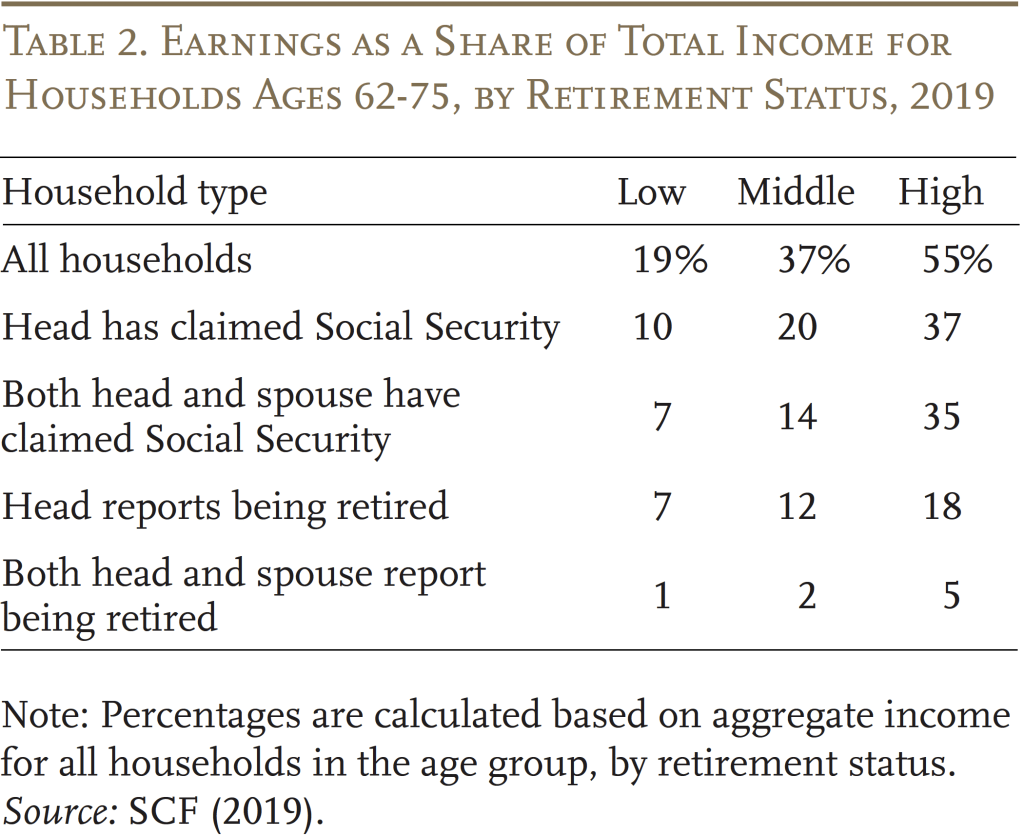
One third of earnings remains outside of the NRRI calculations because the traditional link between claiming and retirement has broken down – particularly for high-income households. Receipt of Social Security benefits used to be a surefire way to classify a household as retired, but high-income households – even when both spouses have claimed – still receive more than a third of their income from earnings (see Table 2). Earnings continue until both the head and the spouse self-report being retired.
Using differential claiming ages has a meaningful effect on households’ retirement readiness across income groups. The impact works through three channels:
- Social Security benefits. Claiming at 62 instead of 65 for the low-income group involves a large actuarial reduction in benefits; claiming at 66 for middle-income households and at 67 for high-income households – instead of 65 – substantially increases benefits.
- Wealth accumulation. Claiming at 66 or 67 rather than 65 provides households with more time to accumulate DC assets, other financial assets, and housing wealth. In contrast, retiring at 62 rather than 65 leaves less time to accumulate wealth.
- Annuity factors. As noted, the NRRI assumes that households convert all their assets and proceeds from a reverse mortgage into a stream of income by purchasing an inflation-indexed annuity. The payments from that annuity increase with the age at which the annuity begins.3The principal limit factor of a reverse mortgage – the proceeds available as a percentage of the home value at a given interest rate, also increases with the age at which the reverse mortgage begins.
Using differential claiming ages also changes the target replacement rates in the same direction as projected replacement rates, but the changes in the targets are much smaller. As a result, changes in the projected rates dominate.
Re-estimating the NRRI
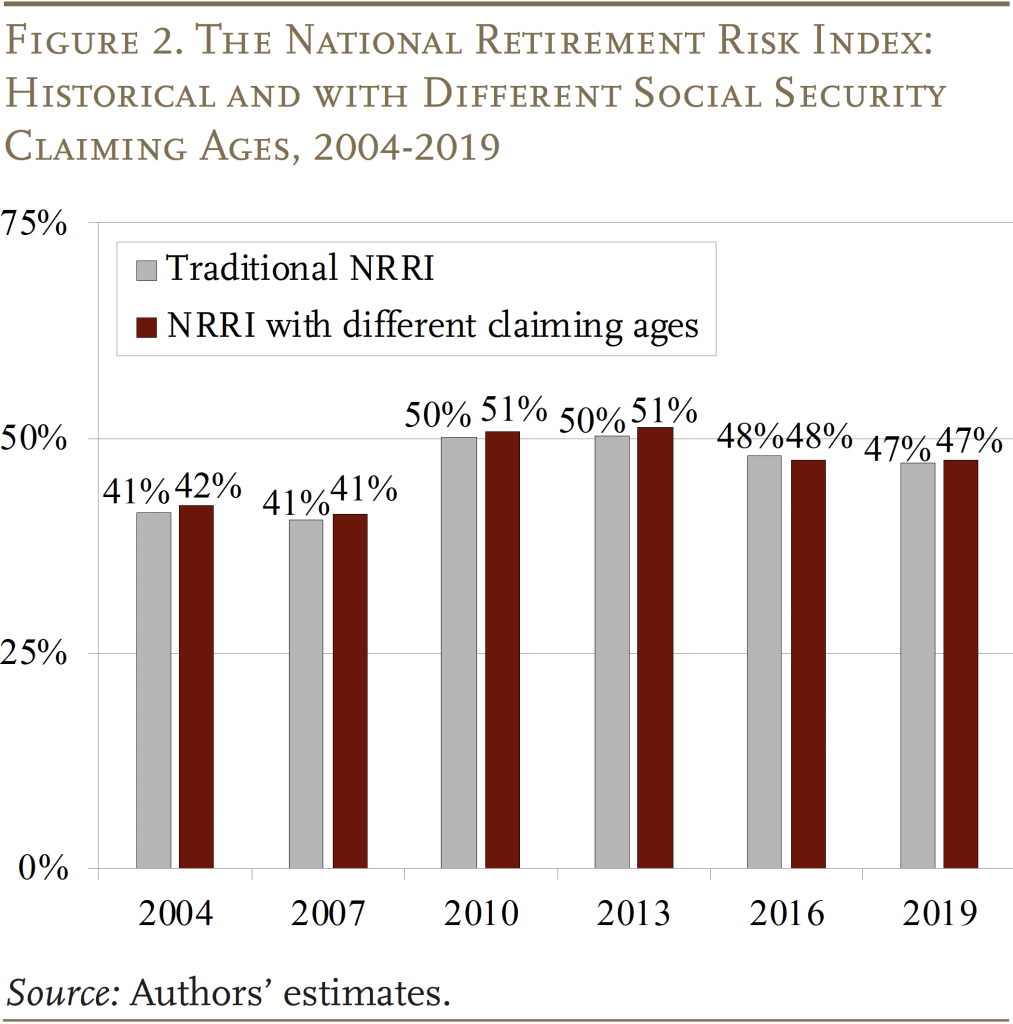
The task is then to re-estimate the NRRI using Social Security claiming ages that vary by income group. Mechanically, the process involves running the model three times – once assuming the claiming age is 62 for all income groups, once assuming 66 for all, and once assuming 67 for all. The percentage of low-income households at risk is derived from the age-62 run; for middle-income households from the age-66 run, and for high-income households from the age-67 run. These results are then combined to produce the revised overall Index, which is shown in Figure 2 with the traditional NRRI. The key finding is that the pattern is identical and the numbers are extremely close – roughly half of households are not prepared for retirement under each measure.
What argues for using the NRRI version with varied claiming ages is that it includes more earnings in the calculation, allows for a more appropriate Social Security actuarial adjustment, and produces a more sensible pattern by income group. As shown in Table 3, varying claiming ages reduces the percentage at risk for high-income households and increases it for those in the low-income tercile. The higher percentage of low-income households at risk confirms findings from other studies.4The severity of the shortfall for low-income households is consistent with the findings of a recent study from Vanguard (see Tan et al. 2023).
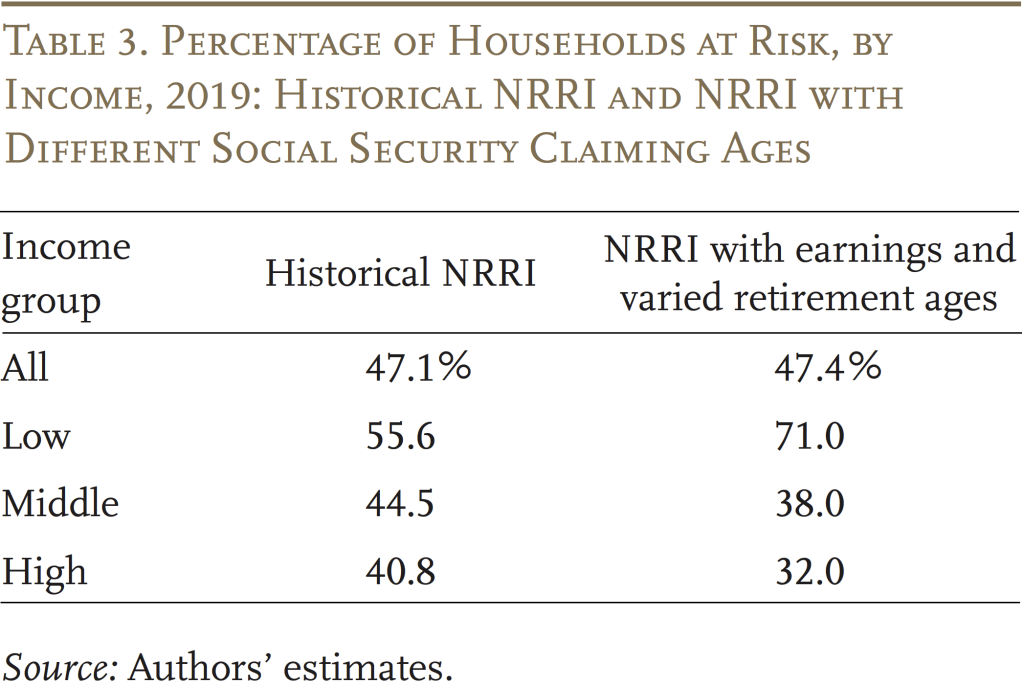
The remaining question is whether continuing to exclude one-third of earnings for workers ages 62-75 is likely to distort the NRRI. One would think not. SCF data show that roughly 80 percent of the excluded earnings accrue to high-income households, so the exclusion likely has no effect on the percentage of households at risk in the low- and middle-income terciles.5Excluded earnings for low-income households are earnings from ages 63-75; middle-income – ages 67-75; and high-income – ages 68-75. Hence, the question narrows to whether some high-income households are mistakenly classified as at risk – that is, less than 32 percent would be at risk if all earnings were included. Answering that question, requires distributing the excluded earnings among high-income households still working at age 68 and annuitizing those amounts over their remaining lifetimes.6Earnings are distributed proportional to household projected earnings at age 62. The “annuitization” is very inelegant; the amounts were simply distributed over an assumed remaining 20 years of life for these high-income households. This exercise only reduces the percentage of high-income households at risk from 32 percent to 30 percent., which suggests that the remaining excluded earnings are not distorting the NRRI.
Conclusion
The NRRI is an attempt to combine all aspects of the retirement landscape into a single number to gauge the adequacy of our system for households at different points in the income distribution and at different moments in time. It requires an enormous amount of data, many assumptions, and numerous decisions – all of which are open for debate. The thing that gives us heart is the stability of the results despite extensive stress testing. Varying the Social Security claiming ages is a case in point. The NRRI headline number still hovers around 50 percent. But the fact that the results produce a better pattern by income group argues for using the new approach as we update the NRRI to incorporate data from the 2022 Survey of Consumer Finances.
References
Biggs, Andrew. 2023. “Will Retirees’ Incomes Be Enough? It Depends on What You Count as Income.” (June 19). New York, NY: Forbes.
Tan, Fu, Fiona Greig, Andrew S. Clarke, Kevin Khang, Kate McKinnon, and Victoria Zhang. 2023. “The Vanguard Retirement Outlook: A National Perspective on Retirement Readiness.” Retirement Outlook Report. Valley Forge, PA: Vanguard.
Endnotes
- 1Biggs (2023).
- 2While inflation-indexed annuities are not widely used by consumers, they provide a convenient metric for calculating the lifetime income that can be obtained from a lump sum. And while inflation-indexed annuities provide a smaller initial benefit than nominal annuities, they protect a household’s purchasing power over time against the erosive effects of inflation.
- 3The principal limit factor of a reverse mortgage – the proceeds available as a percentage of the home value at a given interest rate, also increases with the age at which the reverse mortgage begins.
- 4The severity of the shortfall for low-income households is consistent with the findings of a recent study from Vanguard (see Tan et al. 2023).
- 5Excluded earnings for low-income households are earnings from ages 63-75; middle-income – ages 67-75; and high-income – ages 68-75.
- 6Earnings are distributed proportional to household projected earnings at age 62. The “annuitization” is very inelegant; the amounts were simply distributed over an assumed remaining 20 years of life for these high-income households.


Yin, Yimeng, Anqi Chen, and Alicia H. Munnell. 2023. "The National Retirement Risk Index with Varying Claiming Ages" Issue in Brief 23-23. Chestnut Hill, MA: Center for Retirement Research at Boston College.