
Why Did Disability Insurance Rolls Drop from 2015 to 2019?
The brief’s key findings are:
- In 2015, the number of recipients of Social Security disability insurance (DI) began dropping rapidly.
- A predictable reason was that an aging population led more recipients to move onto retirement benefits.
- More surprisingly, though, the number of new recipients also fell steeply.
- The results suggest this drop was driven by two factors: 1) a strong economy; and 2) a stricter process for awarding benefits on appeal.
- With DI now in a stronger financial position, it may be worth somewhat rebalancing its goals from encouraging work to protecting the vulnerable.
Introduction
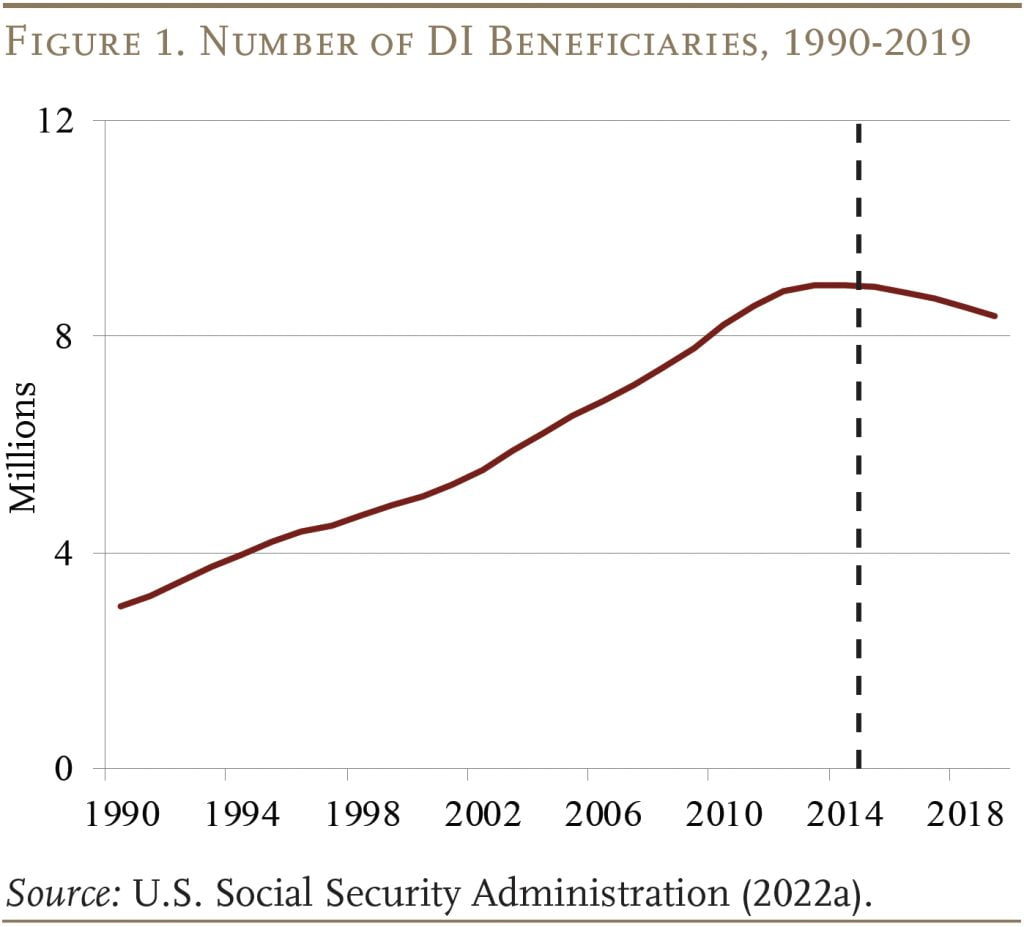
In 2015, the number of individuals receiving Social Security Disability Insurance (DI) benefits began to drop, reversing an upward trend that had persisted for two decades. Policymakers are interested in the extent to which this drop, which has substantially improved the program’s finances, reflects a permanent shift.1In 2015, when DI rolls were at their peak, the Social Security Trustees Report projected that the DI trust fund would deplete its reserves in 2016. In response, policymakers temporarily reallocated a portion of the Social Security payroll tax from the retirement program to the disability program. This infusion of revenue, combined with the falling DI rolls, greatly improved the DI program’s financial position. The 2023 Trustees Report projected that the fund would never deplete its reserves over the 75-year horizon (U.S. Social Security Administration, 2015 and 2023a).
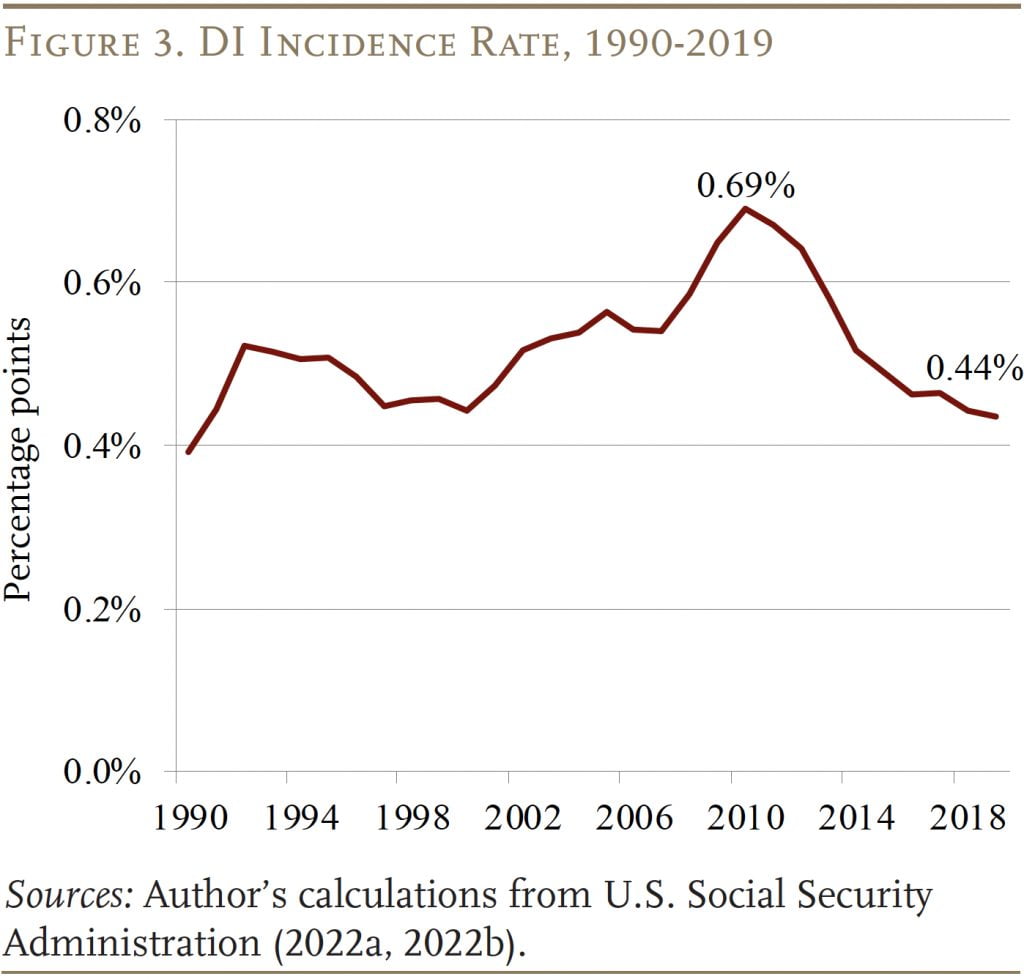
This recent drop in DI rolls is due to increased terminations, as beneficiaries age into Social Security’s retirement program, combined with a steep decline in the incidence rate (the number of new DI awards relative to the insured population) starting in 2010.
Three factors could be playing a role in the declining incidence rate. First, population aging may have reduced the number of DI applications as workers instead claimed their retirement benefits. Second, a strong economy following the Great Recession made DI less attractive to prospective applicants with some ability to work. And third, policy changes at the U.S. Social Security Administration (SSA) – specifically, field office closures and a comprehensive retraining of Administrative Law Judges (ALJs) to reduce the rate of benefits awarded on appeal – increased the difficulty of applying and reduced the share of applicants who were accepted.
This brief, which is based on a recent study, determines the relative contribution of each factor to the drop in the incidence rate from 2010-2019.2Liu and Quinby (2023). The discussion proceeds as follows. The first section provides background on the DI program. The second section highlights trends in the DI rolls over the past 30 years. The third section describes the three factors that could explain the recent decline in the incidence rate. The fourth section outlines the data and methodology for our analysis, while the fifth section displays the results. The final section concludes that a strong economy and the stricter ALJ appeals process each account for about half of the total drop in the incidence rate, while population aging has had only a modest impact.
Background
The DI program provides a basic level of income to people who cannot work due to disability or illness.3For an excellent introduction to the DI program, see Maestas, Mullen, and Strand (2021). In practice, however, the design of the program reflects a tension between twin goals: on the one hand, to protect vulnerable people; and on the other, to encourage labor force participation for those who are able to work.
Workers who apply for DI benefits face a lengthy application process. First, an SSA field office checks that the worker has not engaged in Substantial Gainful Activity (SGA) during the past year.4In 2023, SGA is defined as earning more than $1,470 per month, increasing to $2,460 for workers who are blind. Next, a medical examiner at a state-administered Disability Determination Services office conducts a review. The disability must be expected to last for at least a year and preclude the worker from performing any job in the national economy.5The review considers age, education, and work history, but not geographic location. Workers who meet these criteria are awarded DI benefits starting on the sixth month after disability onset – with initial benefits enhanced to account retroactively for the application period – and are eligible for Medicare after a two-year waiting period. Workers who are denied benefits can appeal to an ALJ. If the ALJ still denies benefits, then the applicant can take their case to the Appeals Council, or even to federal court, but most do not.
Once on the DI rolls, beneficiaries receive a monthly benefit equivalent to their Primary Insurance Amount under Social Security’s Old-Age and Survivors Insurance (OASI) program. Few beneficiaries ever return to work, despite policies encouraging them to do so.6In 2019, less than 1 percent of DI beneficiaries left the program because they returned to work (U.S. Social Security Administration 2022b). Instead, they leave the program upon death or at their Full Retirement Age when they automatically transfer to the OASI program.
Trends in DI Rolls: 1990-2019
From 1990-2015, the number of DI beneficiaries rose steadily due to three factors (see Figure 1). First, policy reforms in 1984 expanded the definition of disability and gave applicants and medical providers more influence over the decision process. Second, disability rates increase with age, and baby boomers were aging into the more lenient eligibility criteria for benefits. Lastly, the rise in female labor force participation increased the fraction of women eligible for benefits, and they too aged into the more lenient criteria. Albeit, at the same time, a strong labor market during much of this period put countervailing pressure on the number of new applications.7Liebman (2015) and Technical Panel on Assumptions and Methods (2015). In recent years, though, the number of beneficiaries has been declining.
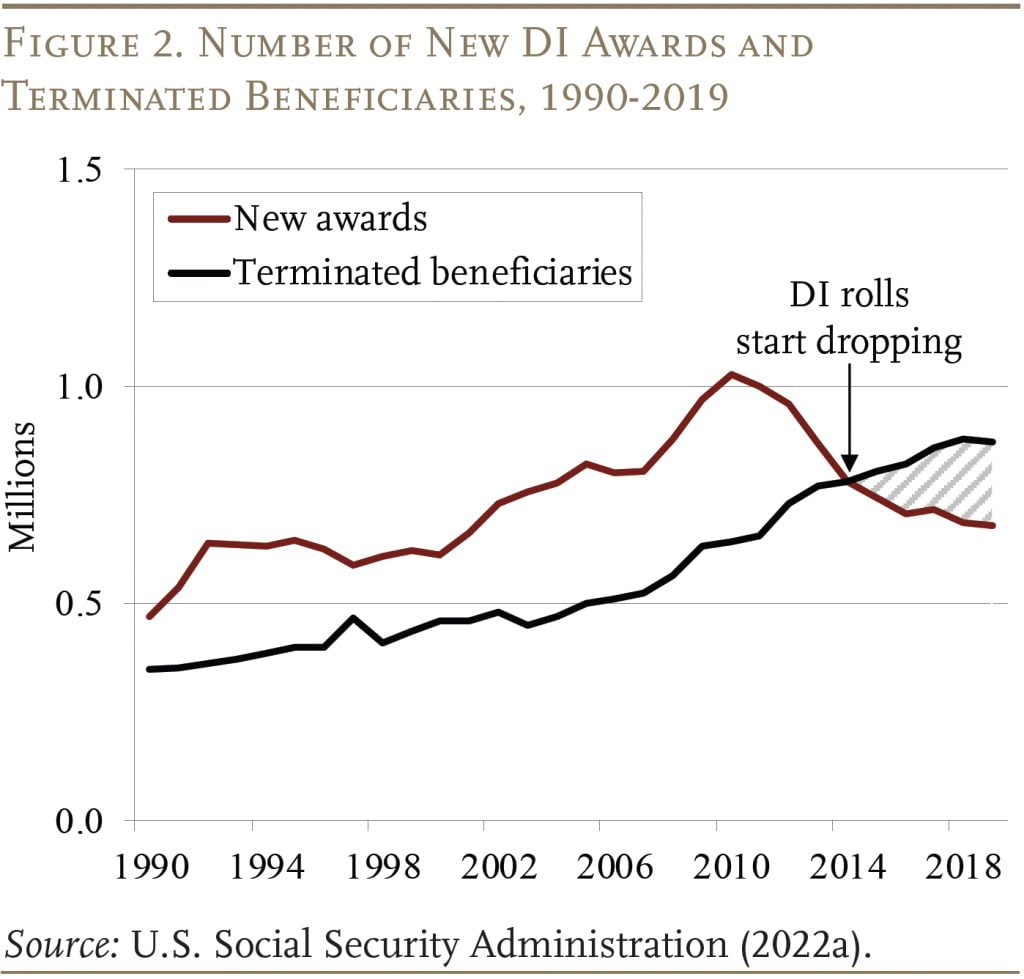
Before 2015, the number of new DI awards always exceeded the number of beneficiaries leaving the program (see Figure 2). But the early 2000s saw an acceleration of beneficiaries aging into the OASI program. And, more importantly, the number of new DI awards has been dropping continuously since 2010. In 2015, the number of new awards finally fell below the number of terminations so the DI rolls began to drop.
The decline in new awards is not due to a contraction of the insured population, which actually grew by almost 3 percent from 2010-2019. Instead, it is due to a decline in the incidence rate, or the likelihood that eligible workers apply for and are awarded benefits (see Figure 3). By 2019, the incidence rate had dropped down to 0.44 percent from its 2010 peak of 0.69 percent.
Although the incidence rate continued to decline during the pandemic, economic conditions, population health, and the policy environment also changed markedly when COVID hit. Most notably, SSA closed all its field offices for a period of two years, coinciding with a sharp drop in DI applications. Since our goal is to understand the structural forces driving down the DI rolls, rather than the temporary impacts of COVID, our analysis stops before the pandemic.8Early research on the pandemic period includes Goda et al. (2022 and 2023 forthcoming).
What Could Explain the Declining Incidence Rate?
The steep decline in the incidence rate could be due to several factors identified in prior studies.9See U.S. Social Security Administration (2019) for a summary of these potential explanations. These factors can be grouped into three categories:
Population Aging. The retirement of the baby boomers is accelerating the rate at which DI beneficiaries leave the program, leading some to speculate that it might also be affecting the number of new applicants. In actuality, a quick look at SSA’s administrative data suggests that population aging is still putting upward pressure on the incidence rate. Application rates for DI increase with age, and the average age of the population targeted by DI is still rising.10We calculate the age gradient in DI application rates and average age of applicants using data on the number of applications by age provided by the SSA’s Office of Disability Programs, and counts of the population target by DI by age from the Current Population Survey. An older applicant pool also implies a higher allowance rate for benefits, given the more lenient eligibility criteria.11However an older applicant pool will also increase terminations in future years. Ultimately, population aging may be affecting the DI rolls through two channels that work in opposite directions: more recipients leaving the program and upward pressure on the incidence rate. The question is, which channel dominated from 2010-2019?
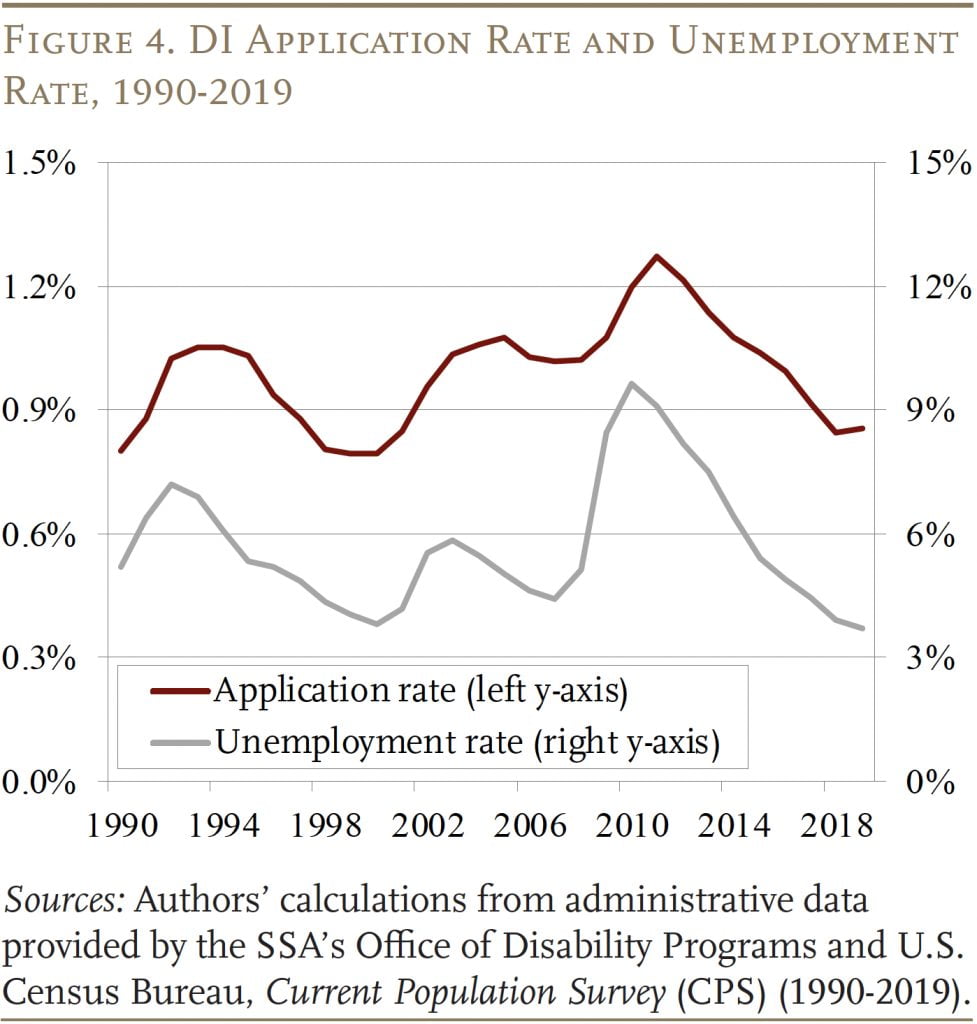
Business Cycle. Since many workers with disabilities retain some work capacity, the DI application process became less attractive when the labor market improved after the Great Recession.12A strong economy also shifts the applicant pool toward those with more severe health conditions, raising the allowance rate (Cutler, Meara, and Richards-Shubik 2012; Liebman 2015; Maestas 2019; and Maestas, Mullen, and Strand 2021). Indeed, analysts have long noted that DI applications rise and fall with the unemployment rate (see Figure 4).13Stapleton et al. (1988); Cutler, Meara, and Richards-Shubik (2012); Liebman (2015); Maestas, Mullen and Strand (2015); and Maestas, Mullen, and Strand (2021).
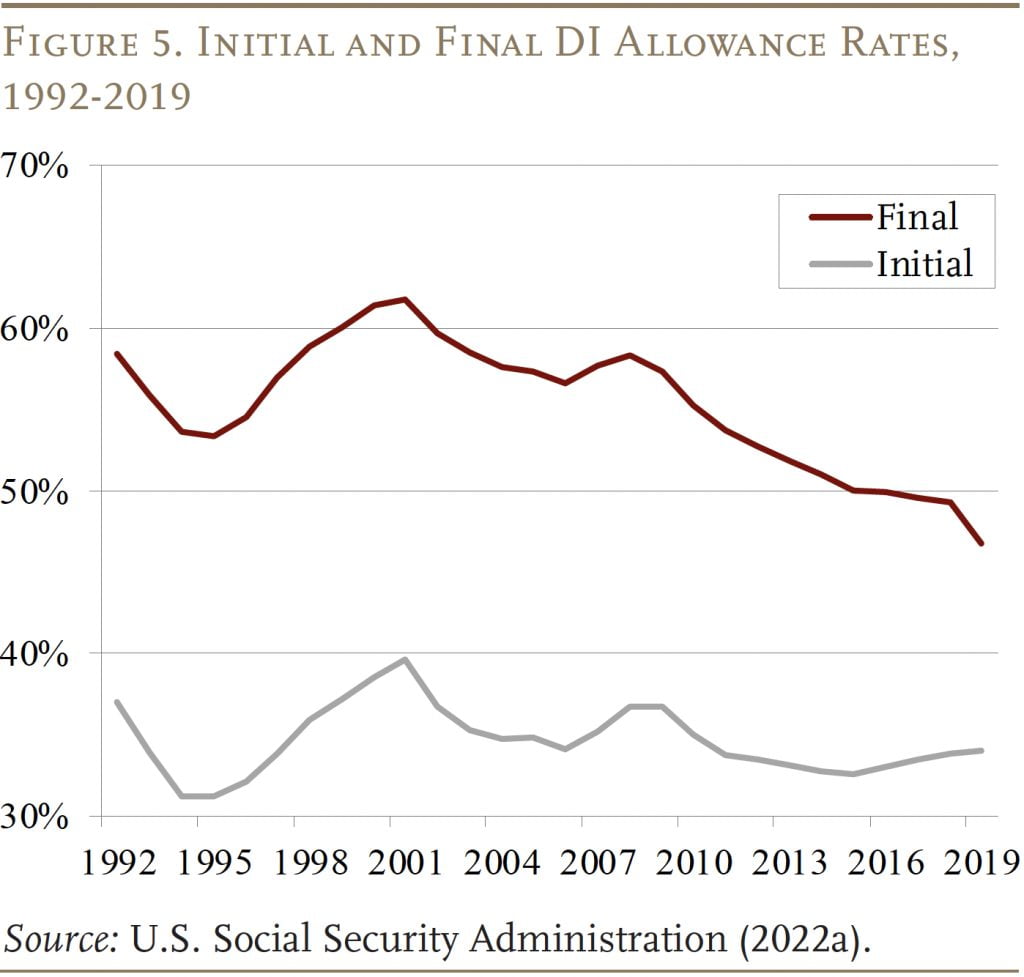
Policy Change. The SSA made two notable changes to the DI program that could have reduced both the number of applications and the approval rate. First, due to budget pressures, the agency closed about 7 percent of its field offices between 2001 and 2013. Since field offices are an important source of assistance, the closures increased the cost of applying and reduced DI applications.14Deshpande and Li (2019). Additionally, in 2010 the SSA undertook a comprehensive retraining of ALJs to improve consistency in their decision-making and reduce appellate approval rates, leading to a decline in the overall allowance rate (see Figure 5).
Data and Methodology
We decompose the drop in the incidence rate by taking the level change in each factor of interest (such as the unemployment rate or number of field offices) and multiplying that change by the impact of each factor on awards. This approach proceeds in three stages.15See Liu and Quinby (2023) for a detailed description of the data and methodology.
The first stage accounts for population aging. It starts by calculating age-specific incidence rates in 2010 using SSA administrative data. These rates are then multiplied by the share of the insured population in each age group in subsequent years and averaged together.16We use the Current Population Survey to estimate the insured population, defined here as people ages 18-64 who are not yet receiving Social Security benefits. This exercise yields the counterfactual incidence rate if all the factors, except aging, had remained at their 2010 levels.17The counterfactual incidence rate is equivalent to the age-adjusted incidence rate in U.S. Social Security Administration (2023b).
The second stage accounts for the business cycle. SSA provided administrative data on DI applications, by state and year, for 1990-2019. We combine these records with insured population counts and unemployment rates – by state and year – from the 1990-2019 Current Population Survey. Regression analysis is then used to estimate how a 1-percentage-point change in the unemployment rate affects the DI application rate. We multiply this regression result by the total decline in unemployment experienced nationally between 2010 and 2019. The resulting drop in DI applications is then multiplied by an allowance rate to show how falling unemployment affected the DI incidence rate.
The third stage accounts for SSA policy changes. To begin, we focus on field offices because a previous study has already established the effects of closures on DI applications and awards in the local area.18Deshpande and Li (2019). Scaling this local estimate to the national level involves multiplying the marginal impact of one closure by the total number of closures and adjusting for the share of the population residing in affected areas.
The final policy is ALJ retraining. Since we lack convincing evidence on the impact of this policy on DI awards, we assume that any remaining difference between the actual observed incidence rate and the counterfactual incidence rate is the effect of ALJ retraining.19While this approach has the advantage of simplicity, it overstates the importance of ALJs if other factors not considered here are also driving down the incidence rate.
Results
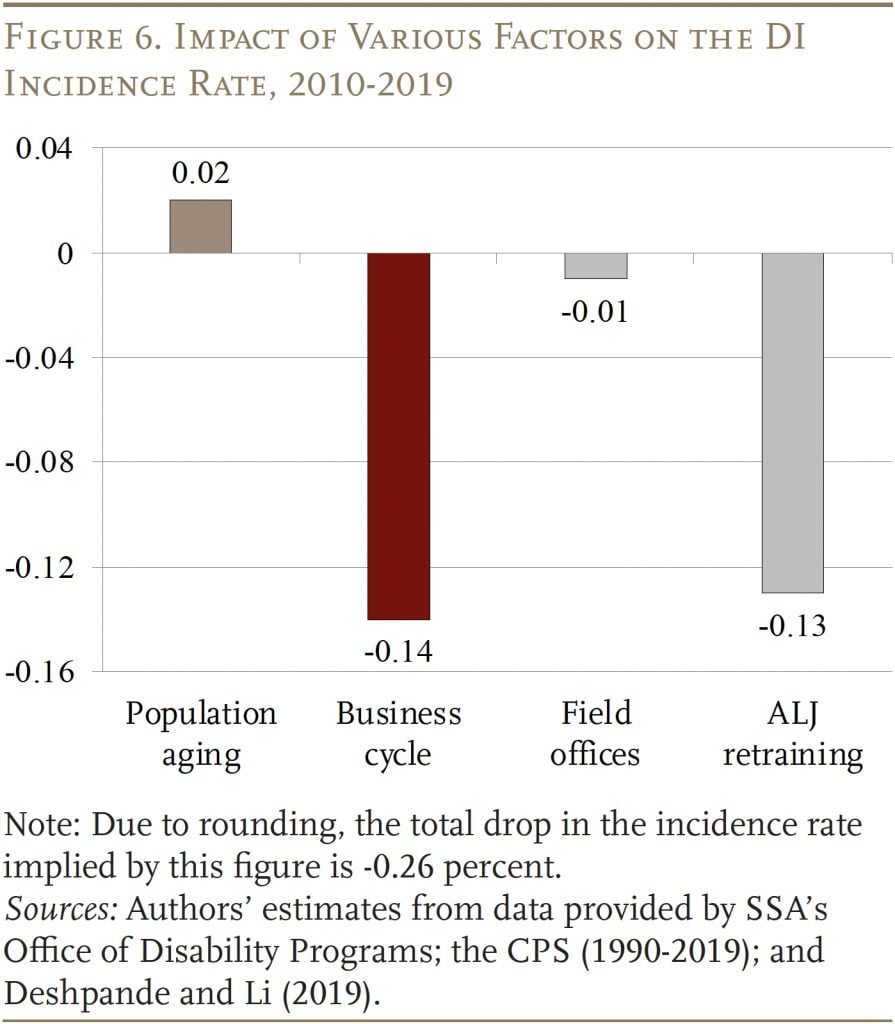
Figure 6 presents the main finding: how much of the 0.25-percentage-point drop in the incidence rate is attributable to the various factors. The gold bar shows that, between 2010 and 2019, population aging would have increased the incidence rate by 0.02 percentage points if all the other factors had stayed constant. The red bar shows the impact of the business cycle, which decreased the incidence rate by 0.14 percentage points. The first gray bar incorporates field office closures, decreasing the rate by a slight 0.01 percentage points.20The effect of field office closures is small because they only affected about 3 percent of the population during our analysis period. Lastly, ALJ retraining reduced the incidence rate by another 0.13 percentage points. Ultimately, the business cycle and ALJ retraining emerge as the two most important factors driving down the incidence rate in recent years.21Our result is consistent with Technical Panel on Assumption and Methods (2019)’s finding that the improving economy and decreasing allowance rates both contribute to the decline in incidence rate. Although the exact numbers are somewhat sensitive to the underlying modelling assumptions, the conclusion holds for a reasonable range of parameters. See Liu and Quinby (2023) for robustness tests.
Conclusion
Between 2015 and 2019, the DI rolls dropped steadily driven by increased terminations and a steep decline in the incidence rate. The falling incidence rate was caused by a strong economy and fewer benefit approvals by the ALJs. While population aging is currently putting slight upward pressure on the incidence rate, it also drives the recent growth in terminations, pushing down the DI rolls overall. With the finances of DI now on a stronger trajectory, the time may have come to somewhat rebalance the goals of DI from encouraging labor force participation to protecting vulnerable people.
References
Cutler, David M., Ellen Meara, and Seth Richards-Shubik. 2012. “Unemployment and Disability: Evidence from the Great Recession.” Working Paper NB 12-12. Cambridge, MA: National Bureau of Economic Research.
Deshpande, Manasi and Yue Li. 2019. “Who is Screened Out? Application Costs and the Targeting of Disability Programs.” American Economic Journal: Economic Policy 11(4): 213-248.
Goda, Gopi Shah, Emilie Jackson, Lauren Hersch Nicholas, and Sarah See Stith. 2022. “The Impact of Covid-19 on Older Workers’ Employment and Social Security Spillovers.” Journal of Population Economics 36: 813-846.
Goda, Gopi Shah, Emilie Jackson, Lauren Hersch Nicholas, and Sarah See Stith. 2023 (forthcoming). “Older Workers’ Employment and Social Security Spillovers Through the Second Year of the Covid-19 Pandemic.” Journal of Pension Economics and Finance.
Liebman, Jeffrey B. 2015. “Understanding the Increase in Disability Insurance Benefit Receipt in the United States.” Journal of Economic Perspectives 29(2): 123-150.
Liu, Siyan and Laura D. Quinby. 2023. “What Factors Explain the Drop in Disability Insurance Rolls from 2015 to 2019?” Working Paper 2023-7. Chestnut Hill, MA: Center for Retirement Research at Boston College.
Maestas, Nicole. 2019. “Identifying Work Capacity and Promoting Work: A Strategy for Modernizing the SSDI Program.” The Annals of the American Academy of Political and Social Science 686(1): 93-120.
Maestas, Nicole, Kathleen J. Mullen, and Alexander Strand. 2015. “Disability Insurance and the Great Recession.” American Economic Review: Papers and Proceedings 105(5): 177-182.
Maestas, Nicole, Kathleen Mullen, and Alexander Strand. 2021. “The Effect of Economic Conditions on the Disability Insurance Program: Evidence from the Great Recession.” Journal of Public Economics 199: 1-22.
Stapleton, David, Kevin Coleman, Kimberly Dietrich, and Gina Livermore. 1988. “Empirical Analyses of DI and SSI Application and Award Growth.” In Growth in Disability Benefits: Explanations and Policy Implications, edited by Kalman Rupp and David Stapleton, 31-92. Kalamazoo, Michigan: W.E. Upjohn Institute for Employment Research.
Technical Panel on Assumptions and Methods. 2019. “Report to the Social Security Advisory Board.” Washington, DC.
Technical Panel on Assumptions and Methods. 2015. “Report to the Social Security Advisory Board.” Washington, DC.
U.S. Social Security Administration. 2023a. Annual Report of the Board of Trustees of the Federal Old-Age and Survivors Insurance and Federal Disability Insurance Trust Funds. Washington, DC.
U.S. Social Security Administration, Office of the Chief Actuary. 2023b. “The Long-Range Disability Assumptions for the 2023 Trustees Report.” Washington, DC.
U.S. Social Security Administration. 2022a. Annual Statistical Report on the Social Security Disability Insurance Program. Washington, DC.
U.S. Social Security Administration. 2022b. Annual Statistical Supplement to the Social Security Bulletin, 2022. Washington, DC.
U.S. Social Security Administration, Office of Retirement and Disability Policy. 2019. “Trends in Social Security Disability Insurance.” Briefing Paper No. 2019-01. Washington, DC.
U.S. Social Security Administration. 2015. Annual Report of the Board of Trustees of the Federal Old-Age and Survivors Insurance and Federal Disability Insurance Trust Funds. Washington, DC.
U.S. Census Bureau. Current Population Survey, 1990-2019. Washington, DC.
Endnotes
- 1In 2015, when DI rolls were at their peak, the Social Security Trustees Report projected that the DI trust fund would deplete its reserves in 2016. In response, policymakers temporarily reallocated a portion of the Social Security payroll tax from the retirement program to the disability program. This infusion of revenue, combined with the falling DI rolls, greatly improved the DI program’s financial position. The 2023 Trustees Report projected that the fund would never deplete its reserves over the 75-year horizon (U.S. Social Security Administration, 2015 and 2023a).
- 2Liu and Quinby (2023).
- 3For an excellent introduction to the DI program, see Maestas, Mullen, and Strand (2021).
- 4In 2023, SGA is defined as earning more than $1,470 per month, increasing to $2,460 for workers who are blind.
- 5The review considers age, education, and work history, but not geographic location. Workers who meet these criteria are awarded DI benefits starting on the sixth month after disability onset – with initial benefits enhanced to account retroactively for the application period – and are eligible for Medicare after a two-year waiting period.
- 6In 2019, less than 1 percent of DI beneficiaries left the program because they returned to work (U.S. Social Security Administration 2022b).
- 7Liebman (2015) and Technical Panel on Assumptions and Methods (2015).
- 8Early research on the pandemic period includes Goda et al. (2022 and 2023 forthcoming).
- 9See U.S. Social Security Administration (2019) for a summary of these potential explanations.
- 10We calculate the age gradient in DI application rates and average age of applicants using data on the number of applications by age provided by the SSA’s Office of Disability Programs, and counts of the population target by DI by age from the Current Population Survey.
- 11However an older applicant pool will also increase terminations in future years.
- 12A strong economy also shifts the applicant pool toward those with more severe health conditions, raising the allowance rate (Cutler, Meara, and Richards-Shubik 2012; Liebman 2015; Maestas 2019; and Maestas, Mullen, and Strand 2021).
- 13Stapleton et al. (1988); Cutler, Meara, and Richards-Shubik (2012); Liebman (2015); Maestas, Mullen and Strand (2015); and Maestas, Mullen, and Strand (2021).
- 14Deshpande and Li (2019).
- 15See Liu and Quinby (2023) for a detailed description of the data and methodology.
- 16We use the Current Population Survey to estimate the insured population, defined here as people ages 18-64 who are not yet receiving Social Security benefits.
- 17The counterfactual incidence rate is equivalent to the age-adjusted incidence rate in U.S. Social Security Administration (2023b).
- 18Deshpande and Li (2019).
- 19While this approach has the advantage of simplicity, it overstates the importance of ALJs if other factors not considered here are also driving down the incidence rate.
- 20The effect of field office closures is small because they only affected about 3 percent of the population during our analysis period.
- 21Our result is consistent with Technical Panel on Assumption and Methods (2019)’s finding that the improving economy and decreasing allowance rates both contribute to the decline in incidence rate. Although the exact numbers are somewhat sensitive to the underlying modelling assumptions, the conclusion holds for a reasonable range of parameters. See Liu and Quinby (2023) for robustness tests.


