Are Older Workers Good for Business?
The brief’s key findings are:
- A common concern is that an aging workforce will reduce productivity and firm profitability, yet the evidence to date is mixed.
- This analysis examines the issue using a large sample from the most recent available Census data that links employees to their employers.
- The results show little evidence that older workers reduce productivity or profitability, although wide variation by industry exists.
- Thus, concern about an aging workforce hampering economic performance may be overblown.
Introduction
The U.S. workforce is rapidly aging, spurring widespread concern over the implications of older workers for the economy at large, and for businesses in particular. Discrimination against older workers in hiring, and employer concerns about the high cost of older workers, suggest that employers view them as less valuable than their younger counterparts.1Neumark, Burn, and Button (2019), for example, show experimental evidence of discrimination against older workers in hiring, while Munnell and Wettstein (2020) find that surveyed employers perceive older workers as more costly. Yet, the evidence from before the turn of the century is decidedly mixed, and recent research on older U.S. workers tends to look at employee motivation and engagement, rather than hard measures of firm performance. Therefore, the productivity and profitability of employing older workers remain an open question.
This brief, which is based on a recent paper, uses restricted U.S. Census Bureau data to relate quantitative measures of worker value – productivity (revenue per worker) and profitability (revenue divided by wages) – to the age distribution of the firm’s employees.2The paper on which this brief is based is Quinby, Wettstein, and Giles (2023). For an example measuring revenue per worker with restricted Census data, see Haltiwanger, Hyatt, and McEntarfer (2017). In addition to a descriptive analysis, this study provides quasi-experimental evidence to get at a causal relationship between the age structure of the workforce and the outcome measures.
The discussion proceeds as follows. The first section summarizes the literature on the business value of older workers. The second section describes the data and the methods for the two analyses, while the third and fourth sections present the results. The final section concludes that, based on our analysis, no support exists for the perception that older workers are less productive than their younger counterparts, and the evidence for any negative impact on profitability is weak. Hence, concern about an aging workforce hampering economic performance may be overblown.
Background
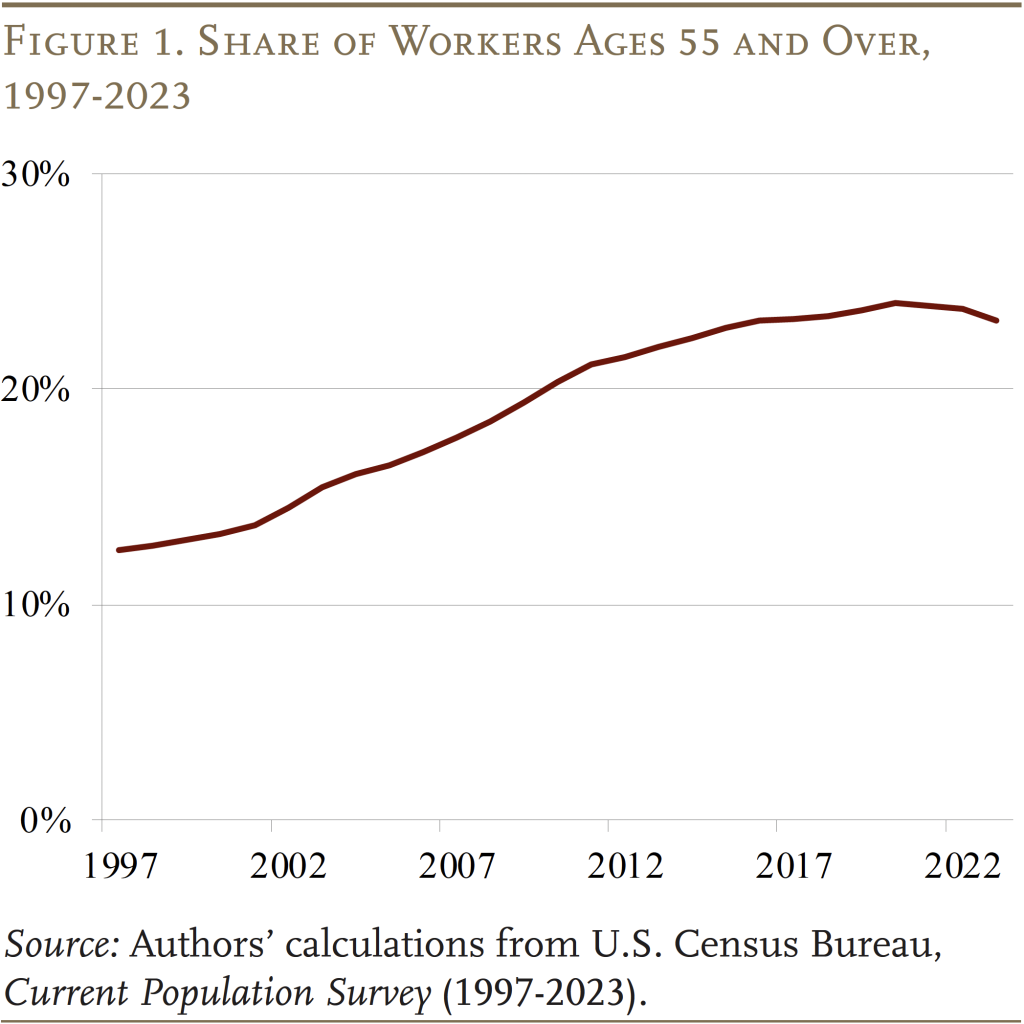
The share of workers ages 55 and over has increased dramatically over the past few decades, doubling since 1997 (see Figure 1). Despite this enormous change in the age structure of the workforce, most research on the productivity of older workers is both dated and contradictory. Two studies from 1999 reach conflicting conclusions on the impact of workers ages 55 and over; one finds that having a larger share of such workers reduces a firm’s productivity, while the other study finds (statistically insignificant) evidence that output may increase with a higher share of older workers.3Seminal research on the topic includes Haltiwanger, Lane, and Spletzer (1999) and Hellerstein, Neumark, and Troske (1999). Potentially more concerning, the most recent estimates of worker productivity use data from over two decades ago.4Haltiwanger, Lane, and Spletzer (2007) use data running only to 1997.

Instead of quantitative outcomes, recent evidence in the U.S. context tends to rely on qualitative assessments or imperfect proxies of productivity, such as turnover rates.5Finkelstein and Block (2015) documented the benefits of older workers’ skills, experience, and tenure in small businesses, while Aon Hewitt (2015) had similar findings for large businesses. But meta-analyses of studies using indirect measures of performance also reach diverging conclusions: one finds that advanced worker age is detrimental in general, while the other concludes that age is positively associated with work-related performance.6See Sturman (2003) and Ng and Feldman (2008), respectively. Meanwhile, macroeconomic evidence suggests that, at least at the aggregate level, an older workforce slows productivity growth.7Feyrer (2007, 2008) finds that, across countries, older labor forces are associated with lower productivity at the macro level. Maestas, Mullen, and Powell (2023) find similar results at the state level in the United States. Substantially more research exists in the European context. Here too, however, the conclusions vary widely.8Aubert and Crépon (2006) find no evidence that the productivity of older workers differs from that of prime-age workers; Malmberg, Lindh, and Halvarsson (2008) and Borsch-Supan and Weiss (2016) conclude that older workers are more productive; and Lovász and Rigó (2013), Vandenberghe (2013), and Ilmakunnas and Maliranta (2016) show that older workers reduce productivity. Given these variations, it is unsurprising that Mahlberg et al. (2013) show that the relationship between age and productivity varies by location and sector, motivating a renewed look at the United States, and underscoring the importance of up-to-date estimates.
Data and Methodology
The major challenge in assessing the productivity and profitability of older workers is access to data that link employees to their employers. This information comes from merging three databases. The U.S. Census Bureau’s Longitudinal Employer-Household Dynamics (LEHD) links state administrative unemployment insurance records, IRS employer tax information, and Census data on establishments to provide an accurate and comprehensive account of employment and earnings at detailed geographic and industry levels. The Longitudinal Business Database (LBD) provides data on firm payroll and number of employees, and the Census’ Business Register (CBR) is a comprehensive listing of the location and industry of all domestic business establishments. Linking these three datasets makes it possible to track businesses and establishments over time, while observing their revenues and payroll, and the age composition (and other demographics) of their workforces. The data available for this analysis span 1997-2014.
The analysis has two parts. The main analysis uses a regression equation to estimate the relationship between the share of a firm’s workers ages 55 and over and that firm’s productivity and profitability, and how these associations vary by industry. Productivity is defined as the total revenues of a firm divided by its employees. Profitability is defined as how much revenue is generated per dollar of payroll. Firms are divided by industry using standard classifications.9The firms are classified by their two-digit North American Industry Classification System (NAICS) codes. The exception is that agriculture, mining, utilities, and construction are considered one industry, ensuring that these relatively small industries are broad enough to maintain privacy for the relevant establishments. Also, public administration is omitted since it is unclear that revenue is a good indicator of productivity in the context of public services.
Since having a retirement plan at the firm could allow marginal older workers to retire more easily, leaving only more productive workers, the analysis controls for plan availability. The analysis also controls for firm size and age, and other demographics of the workforce (gender, race/ethnicity, and educational attainment) to ensure the comparison is between firms with otherwise similar workforces. Finally, the estimated regressions control for geography and secular trends in productivity.
These criteria yield the following equation:
Productivity (Profitability) = ƒ (% older workers, % prime-age workers, % older workers * % prime-age workers, controls)10Specifically, the firm-level controls are: size and age of the firm and an indicator for whether it offers a retirement plan; the demographics of its workforce: share female, Black, Asian, Pacific Islander, mixed-race, Hispanic; those with some college and those with a college or postgraduate degree; and the commuting zone and state-by-year fixed effects. Standard errors are clustered by commuting zone, and the regressions are weighted by the number of employees at the firm.
The thought experiment is how productivity and profits would change if the share of older workers were increased by one percentage point at the expense of reducing the share of workers under age 30. This tradeoff between the oldest and youngest workers makes sense since the more extreme-age workers are more likely to be part-time, less likely to be strongly attached to the employer, and generally have more elastic labor supply.11Fiorito and Zanella (2012). In conducting this thought experiment, it is important to account for possible complementarity between older and younger workers.12Backes-Gellner and Veen (2013). The estimated relationship between older workers and firm outcomes thus depends on the existing share of prime-age workers who might be complemented or substituted by these older workers. The measure of interest is, therefore, the coefficient on “share older workers” plus the coefficient on the interaction “share of older workers * share of prime-age workers” where the share of prime-age workers is set equal to the share for the firm’s industry.
While the regression above will show the correlation between the share of older workers and the productivity and profitability of the firm, it will not yield a causal estimate of the effect of older workers on productivity. For example, if firms with low productivity tend not to hire new workers, the estimate will show that older workers reduce productivity when, in fact, it is low productivity that leads to an older workforce.
Hence the second part of the analysis turns to a quasi-experimental approach, using the age structure of the labor market in which the firm is located as an instrumental variable for the actual share of the workforce 55 and over. The goal is to separate the composition of the firm’s workforce from the demand for its product to address the likelihood that older workers are stuck in declining industries, where employers are not hiring young workers. Some industries, particularly manufacturing, do not seem to have a clear link between their geographic location and their product market. Hence, the quasi-experimental approach restricts attention to single-establishment manufacturing firms and considers their commuting zones.
Results: Descriptive Estimates of the Value of Older Workers
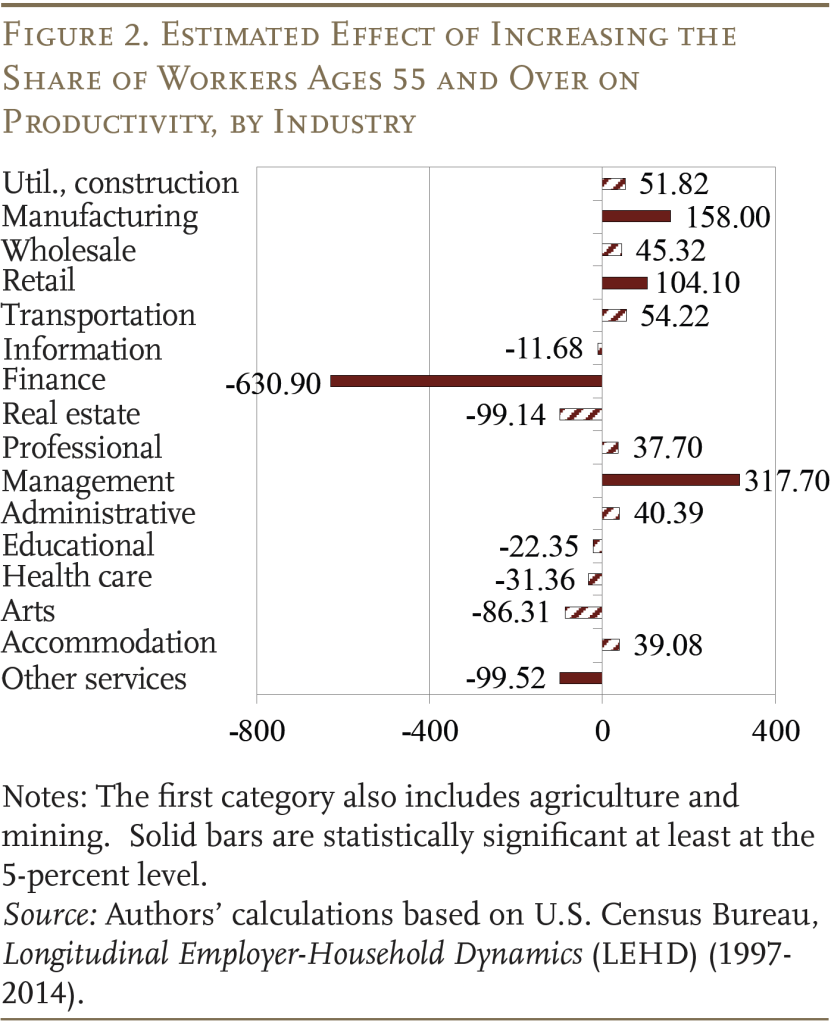
The descriptive results for productivity do not show a clear pattern of a negative relationship with an older workforce (see Figure 2). Excluding finance, which is a clear outlier (for both productivity and profitability), other industries are roughly evenly distributed around 0, with those displaying a negative relationship with age (such as “other [non-public] services”) generally more than counterbalanced by industries displaying a positive relationship with age (such as retail).

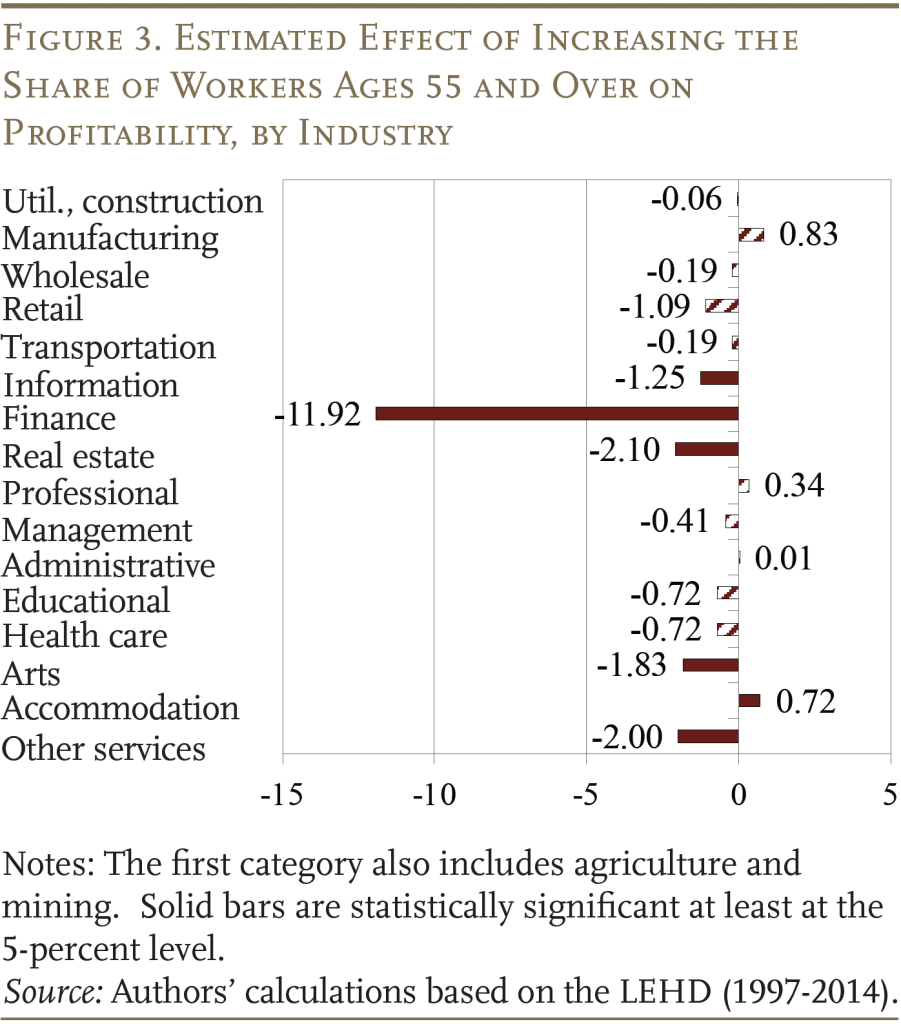
The picture for profitability is more lopsided, with the estimates generally indicating that a larger share of older workers is associated with lower profits (see Figure 3). The magnitude of the relationship is substantial; for many industries, a 1-percentage-point increase in the share of older workers is associated with a $1 or more decline in revenue to payroll, while the mean ratio of revenue to payroll is $6.2.13Furthermore, considering a more comprehensive measure of compensation beyond payroll is likely to aggravate this relationship: older workers are likely to cost more in health insurance premiums and in deferred compensation such as defined benefit pension costs or employer matches to defined contribution plans. This pattern is consistent with a large body of empirical evidence that wages continue to increase with tenure even after productivity growth has flattened out.

In short, older workers appear to be as productive as younger workers, but they cost more. However, as noted above, a concern with all these estimates is that a declining firm may have a large share of older workers because younger workers do not wish to enter it. If so, the relationship between the share of older workers and firm performance would be negative, but this relationship would not mean that an increasingly older workforce was causing less profitability. The next section summarizes the results of the quasi-experimental estimation aimed at addressing this concern.
Results: Quasi-Experimental Estimates
The quasi-experimental results of the value of older workers in manufacturing support the hypothesis that the descriptive results are biased. Mechanically, the results show that the share of the commuting-zone population ages 55 and over is indeed predictive of the share of older workers in the commuting-zone’s manufacturing establishments.14The F-statistic for the first-stage regression is 4.2, which is predictive but indicates a moderately weak instrument. Thus, the analysis proceeds to use the estimated share of the population ages 55 and over as the instrumental variable.15The quasi-experimental regressions mirror those above, except that they do not control for the share of prime-age workers and “share older workers” will be replaced by the prediction generated by the instrumental variable.
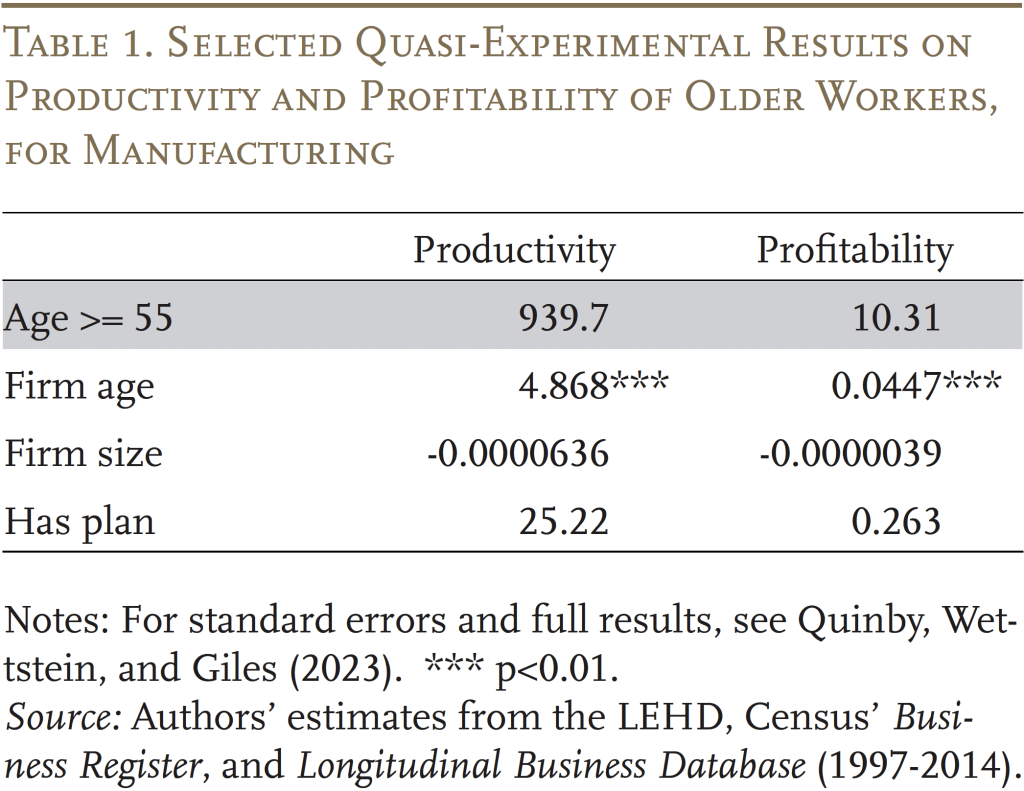
Selected results of the second stage of this quasi-experimental procedure are shown in Table 1. The key finding is that the share of older workers is not statistically significantly related to productivity or profitability.

Conclusion
As the working population ages, a prevalent worry is that this demographic trend will undermine prospects for economic prosperity. From the narrower perspective of employers, workforce aging raises the possibility that productivity and profitability will be set back. The evidence of age discrimination in hiring suggests that some employers are being influenced by these fears in practical management decisions. And advocates for longer working lives must contend with the fact that little evidence exists to disprove such fears.
The current analysis lays out evidence based on the most recent available data, for the largest possible sample, covering the vast majority of U.S. employment. The findings give reason to hope that, in general, workforce aging is not a major concern for firm productivity and profitability. While estimates vary by industry, as a whole we find little evidence that older workers are systematically associated with lower productivity as compared to very young workers. Furthermore, a secondary analysis aimed at addressing issues of reverse causality similarly finds no evidence that older workers causally reduce productivity or profitability in the limited, but important, manufacturing sector.
References
Aon Hewitt. 2015. “A Business Case for Older Workers Age 50+: A Look at the Value of Experience.” Washington, DC: AARP.
Aubert, Patrick and Bruno Crépon. 2006. “Age, Wage and Productivity: Firm-Level Evidence.” Working Paper.
Backes-Gellner, Uschi and Stephan Veen. 2013. “Positive Effects of Ageing and Age Diversity in Innovative Companies – Large-Scale Empirical Evidence on Company Productivity.” Human Resource Management Journal 23(3): 279-295.
Borsch-Supan, Axel and Matthias Weiss. 2016. “Productivity and Age: Evidence from Work Teams at the Assembly Line.” The Journal of the Economics of Ageing 7(C): 30-42.
Finkelstein, Ruth and Dorian Block. 2015. “10 Advantages of Retaining and Hiring Older Workers.” New York, NY: Columbia University, The Robert N. Butler Aging Center and the Mailman School of Public Health.
Fiorito, Riccardo and Giulio Zanella. 2012. “The Anatomy of the Aggregate Labor Supply Elasticity.” Review of Economic Dynamics 15: 171-187.
Feyrer, James. 2007. “Demographics and Productivity.” Review of Economics and Statistics 89(1): 100-109.
Feyrer, James. 2008. “Aggregate Evidence on the Link Between Age Structure and Productivity.” Population and Development Review 34: 78-99.
Haltiwanger, John, Henry Hyatt, and Erika McEntarfer. 2017. “Who Moves Up the Job Ladder?” Working Paper 23693. Cambridge, MA: National Bureau of Economic Research.
Haltiwanger, John, Julia Lane, and James Spletzer. 1999. “Productivity Differences across Employers: The Roles of Employer Size, Age, and Human Capital.” American Economic Review 89(2): 94-98.
Haltiwanger, John, Julia Lane, and James Spletzer. 2007. “Wages, Productivity, and the Dynamic Interaction of Businesses and Workers.” Labor Economics 14(3): 575-602.
Hellerstein, Judith, David Neumark, and Kenneth Troske. 1999. “Wages, Productivity, and Worker Characteristics: Evidence from Plant-Level Production Functions and Wage Equations.” Journal of Labor Economics 17(3): 409-446.
Ilmakunnas, Pekka and Mika Maliranta. 2016. “How Does the Age Structure of Worker Flows Affect Firm Performance?” Journal of Productivity Analysis 46: 43-62.
Lovász, Anna and Mariann Rigó. 2013. “Vintage Effects, Aging and Productivity.” Labour Economics 22(C): 47-60.
Maestas, Nicole, Kathleen J. Mullen, and David Powell. 2023. “The Effect of Population Aging on Economic Growth, the Labor Force and Productivity.” American Economic Journal: Macroeconomics 15(2): 306-332.
Mahlberg, Bernhard, Inga Freund, Jesús Crespo Cuaresma, and Alexia Prskawetz. 2013. “The Age-Productivity Pattern: Do Location and Sector Affiliation Matter?” The Journal of the Economics of Ageing 1-2: 72-82.
Malmberg, Bo, Thomas Lindh, and Max Halvarsson. 2008. “Productivity Consequences of Workforce Aging: Stagnation or Horndal Effect.” Population and Development Review 34: 238-256.
Munnell, Alicia H. and Gal Wettstein. 2020. “Employer Perceptions of Older Workers – Surveys from 2019 and 2006.” Working Paper 2020-8. Chestnut Hill, MA: Center for Retirement Research.
Neumark, David, Ian Burn, and Patrick Button. 2019. “Is It Harder for Older Workers to Find Jobs? New and Improved Evidence from a Field Experiment.” Journal of Political Economy 127(2): 922-970.
Ng, Thomas W. H. and Daniel C. Feldman. 2008. “The Relationship of Age to Ten Dimensions of Job Performance.” Journal of Applied Psychology 93(2): 392-423.
Quinby, Laura D., Gal Wettstein, and James Giles. “Are Older Workers Good for Business?” Working Paper 2023-19. Chestnut Hill, MA: Center for Retirement Research at Boston College.
Sturman, Michael C. 2003. “Searching for the Inverted U-Shaped Relationship Between Time and Performance: Meta-Analyses of the Experience/Performance, Tenure/Performance, and Age/Performance Relationships.” Journal of Management 29(5): 609-640.
U.S. Census Bureau. Business Register, Longitudinal Business Database, and Longitudinal Employer-Household Dynamics, 1997-2014. Washington, DC.
U.S. Census Bureau. Current Population Survey, 1997-2023. Washington, DC.
Vandenberghe, Vincent. 2013. “Are Firms Willing to Employ a Greying and Feminizing Workforce?” Labour Economics 22: 30-46.
Endnotes
- 1Neumark, Burn, and Button (2019), for example, show experimental evidence of discrimination against older workers in hiring, while Munnell and Wettstein (2020) find that surveyed employers perceive older workers as more costly.
- 2The paper on which this brief is based is Quinby, Wettstein, and Giles (2023). For an example measuring revenue per worker with restricted Census data, see Haltiwanger, Hyatt, and McEntarfer (2017).
- 3Seminal research on the topic includes Haltiwanger, Lane, and Spletzer (1999) and Hellerstein, Neumark, and Troske (1999).
- 4Haltiwanger, Lane, and Spletzer (2007) use data running only to 1997.
- 5Finkelstein and Block (2015) documented the benefits of older workers’ skills, experience, and tenure in small businesses, while Aon Hewitt (2015) had similar findings for large businesses.
- 6See Sturman (2003) and Ng and Feldman (2008), respectively.
- 7Feyrer (2007, 2008) finds that, across countries, older labor forces are associated with lower productivity at the macro level. Maestas, Mullen, and Powell (2023) find similar results at the state level in the United States.
- 8Aubert and Crépon (2006) find no evidence that the productivity of older workers differs from that of prime-age workers; Malmberg, Lindh, and Halvarsson (2008) and Borsch-Supan and Weiss (2016) conclude that older workers are more productive; and Lovász and Rigó (2013), Vandenberghe (2013), and Ilmakunnas and Maliranta (2016) show that older workers reduce productivity. Given these variations, it is unsurprising that Mahlberg et al. (2013) show that the relationship between age and productivity varies by location and sector, motivating a renewed look at the United States, and underscoring the importance of up-to-date estimates.
- 9The firms are classified by their two-digit North American Industry Classification System (NAICS) codes. The exception is that agriculture, mining, utilities, and construction are considered one industry, ensuring that these relatively small industries are broad enough to maintain privacy for the relevant establishments. Also, public administration is omitted since it is unclear that revenue is a good indicator of productivity in the context of public services.
- 10Specifically, the firm-level controls are: size and age of the firm and an indicator for whether it offers a retirement plan; the demographics of its workforce: share female, Black, Asian, Pacific Islander, mixed-race, Hispanic; those with some college and those with a college or postgraduate degree; and the commuting zone and state-by-year fixed effects. Standard errors are clustered by commuting zone, and the regressions are weighted by the number of employees at the firm.
- 11Fiorito and Zanella (2012).
- 12Backes-Gellner and Veen (2013).
- 13Furthermore, considering a more comprehensive measure of compensation beyond payroll is likely to aggravate this relationship: older workers are likely to cost more in health insurance premiums and in deferred compensation such as defined benefit pension costs or employer matches to defined contribution plans.
- 14The F-statistic for the first-stage regression is 4.2, which is predictive but indicates a moderately weak instrument.
- 15The quasi-experimental regressions mirror those above, except that they do not control for the share of prime-age workers and “share older workers” will be replaced by the prediction generated by the instrumental variable.


