
The National Retirement Risk Index: Version 2.0

The brief’s key findings are:
- The National Retirement Risk Index captures the share of working-age households that could fall short in retirement.
- Recent upgrades to the Index allow for more accurate measurement and analysis.
- The retooled Index confirms earlier findings: half of households will not be able to maintain their standard of living when they retire.
Introduction
The National Retirement Risk Index (NRRI) measures the share of working-age households that is “at-risk” of being unable to maintain their pre-retirement standard of living in retirement. The exercise involves comparing households’ projected replacement rates – retirement income as a percentage of pre-retirement income – with target rates that would allow them to maintain their living standard. The key finding is that roughly half of the nation’s working-age households are at risk of falling short even if they work to age 65 and annuitize all their assets. This result is stable over time, with some ups and downs reflecting economic and market fluctuations.
Since its inception, the Center has periodically made modest changes to the NRRI. Recently, however, we undertook a major overhaul to incorporate new research findings and methodological advances. To maintain transparency of the NRRI, this brief summarizes the changes and presents results for the recalculated Index.1The original methodology was described in Munnell, Webb, and Delorme (2006).
The discussion proceeds as follows. The first section describes the nuts and bolts of the NRRI. The second section documents the major improvements in the NRRI’s underlying methodology. The third section presents the main results, which are generally consistent with those from previous NRRI publications. The final section concludes that retirement readiness remains a major challenge for many of today’s working-age households; they need to save more and/or work longer to improve their prospects for a secure retirement.
Nuts and Bolts of the NRRI
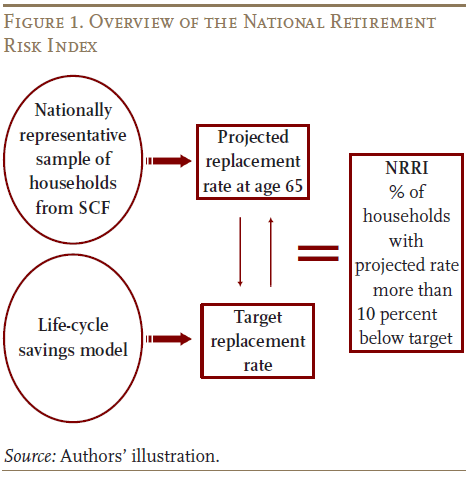
The NRRI is constructed with data from the Federal Reserve’s Survey of Consumer Finances (SCF), a triennial nationally representative household survey. Calculating the NRRI involves three steps: 1) projecting a replacement rate – retirement income as a share of pre-retirement income – for each SCF household ages 30-59; 2) constructing a target replacement rate that would allow each household to maintain its pre-retirement standard of living in retirement; and 3) comparing the projected and target rates to find the percentage of households “at risk” (see Figure 1 ).
Projecting Household Replacement Rates
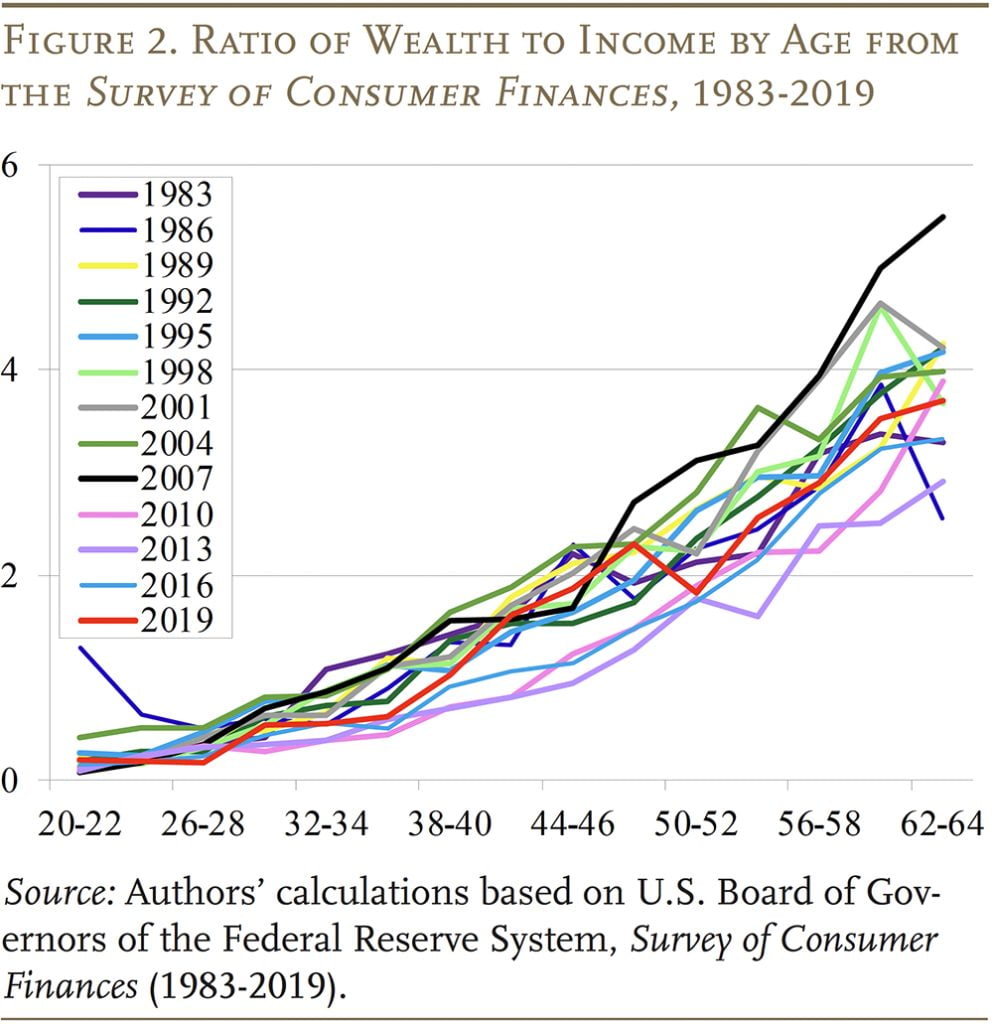
The replacement rate calculation starts with a projection of retirement income at age 65. This measure is defined broadly to include income from Social Security, defined benefit (DB) plans; financial assets both in defined contribution (DC) plans and saved directly; and housing, which includes imputed rent as well as home equity.2The Index does not include income from work in retirement, since labor force participation declines after age 65. The asset values for the latter three components – DC assets, non-DC financial assets, and housing equity – are derived from reported wealth in the SCF. They are each projected separately to age 65 based on their respective wealth-to-income ratios by age, which are stable over time. As shown in Figure 2, the overall wealth-to-income ratios from the 1983-2019 SCF surveys rest roughly on top of one another, bracketed by 2007 values on the high side and 2013 values on the low side.
The NRRI then assumes that households convert all their assets, including financial assets, 401(k)/IRA balances, and proceeds from a reverse mortgage, into a stream of income by purchasing an inflation-indexed annuity.3While inflation-indexed annuities are not widely used by consumers, they provide a convenient metric for calculating the lifetime income that can be obtained from a lump sum. And while inflation-indexed annuities provide a smaller initial benefit than nominal annuities, they protect a household’s purchasing power over time against the erosive effects of inflation.
Sources of retirement income that are not derived from reported wealth in the SCF are estimated directly. Specifically, Social Security benefits are calculated based on estimated earnings histories for each member of the household, indexed to national average wage growth. DB pension income is based on the amount reported by survey respondents.
The remaining step is to calculate average lifetime income prior to retirement. Pre-retirement income for homeowners includes earnings and imputed rent from housing. Average lifetime income (with earnings, again, indexed to average wage growth) then serves as the denominator for each household’s replacement rate. This measure excludes income from assets.
Estimating Target Replacement Rates
To determine the share of the population that will be at risk requires comparing projected replacement rates with a benchmark rate. A commonly used benchmark is the replacement rate needed for households to maintain their pre-retirement standard of living in retirement. People typically need less than their full pre-retirement income since they generally pay less in taxes, no longer need to save for retirement, and often have paid off their mortgage. Thus, a greater share of their income is available for spending.4The level of replacement required for smoothing consumption before and after retirement will vary by type of household. For example, low-income households get most of their retirement income from Social Security and therefore need little saving before retirement. The result is that they get little break from no longer having to save in retirement. Similarly, low-income households pay little in taxes, so they receive little in the way of tax saving in retirement. Thus, low-income households need a higher replacement rate in retirement. The Index estimates the target replacement rates for different types of households using a consumption-smoothing model, which is based on the assumption that households want the same level of consumption in retirement as they had before they retired.
Calculating the Index
The final step is to compare each household’s projected replacement rate with the target from the consumption-smoothing model. Those whose projected replacement rates fall more than 10 percent below the target are deemed to be at risk of having insufficient income to maintain their pre-retirement standard of living. The Index is simply the percentage of all working-age households that fall more than 10 percent short of their targets.5It is important to note that the practical meaning of “at risk” differs by a household’s level of income. For example, at-risk households with very low income may have trouble affording life’s basic necessities. In contrast, at-risk households with high income are not in danger of falling into poverty. However, they do face the prospect of a difficult adjustment that may require them to lower their expectations of their retirement lifestyle.
Major Improvements
Although the overall modeling framework described above remains unchanged, the updated NRRI includes the following major improvements.
Projects retirement income more accurately. The biggest change to the NRRI is modifying the projection of wealth-to-income ratios for each household to more accurately reflect the wealth distributions observed in the data. The previous projection method was based on the mean wealth growth paths estimated by a linear regression approach.6The previous approach involves two steps: it first estimates average growth paths of wealth-to-income ratios across ages using linear regressions, which is done for the bottom, middle, and top third of the income distribution separately; it then adjusts the average wealth growth paths for each household based on their current wealth relative to the average level and projects the wealth-to-income ratio to age 62 using the adjusted growth paths. A drawback to this approach is that, given growing wealth inequality, the results are increasingly biased toward the accumulation paths of richer households.7The previous method imposes restrictions on the resulting projected distributions, which can partially reduce the bias. However, the rise in wealth inequality over time makes it increasingly difficult to rely on this approach. Thus, the old method tended to overestimate the wealth of middle- and lower-income households. In contrast, the new method projects wealth based on median values, which makes the wealth projections at retirement better reflect the observed distributions.8For each type of wealth, the new method breaks down the distribution of wealth-to-income ratio within a given age group into 20 percentile groups and calculates the median value of each group. Then, 20 wealth growth paths are constructed by connecting the median values from corresponding percentile groups across age. For example, the fifth path consists of the median wealth-to-income ratios of the fifth percentile group (20th-25th percentiles) in all age groups. The paths are constructed for the low-, middle-, and high-income groups separately.
Better reflects the shift from DB to DC plans. The growing share of workers covered by DC plans since the 1980s means that the level and pattern of DC asset accumulation differs across birth cohorts. To account for these differences, the new method projects DC assets separately for three broad cohorts: 1) workers born before 1945, who were at least halfway into their careers when coverage under DC plans began to expand in 1980; 2) workers born from 1945-1955, who were early in their careers during the transition to DC plans; and 3) workers born after 1955, whose careers mostly fall in the years when DC plans were already prevalent.9The median ratios of DC wealth to income near retirement (ages 60~62) for these three birth cohorts are 0.75, 1.25, and 1.45 respectively. Recent studies found an unexpected decline in the 401(k)/IRA wealth for Late Boomers compared to earlier cohorts, but the main reasons for the decline are still not clear (Chen, Hou, and Munnell 2020). The Center will keep tracking this trend and incorporate new findings into the NRRI as warranted.
Models financial debt separately. The original wealth projection method subtracts households’ non-mortgage debts from their financial assets and projects the resulting net financial assets as a single variable. Analyses of previous NRRI results suggest that the dynamics of financial debt can be of interest on their own. For example, middle-age and middle-income households saw very limited improvements in retirement preparedness in 2016 partly due to increased non-mortgage borrowing.10See Munnell, Hou, and Sanzenbacher (2018). The new method now projects financial assets and non-mortgage debt separately, allowing for more in-depth analysis as well as counterfactual analysis focusing on borrowing.
Refines the target replacement rate model. In the original method, target replacement rates were calculated and matched to observed households in the SCF in an approximate manner: targets were calculated for 12 household categories determined by four household types (single male, single female, married with two earners, and married with one earner) and three income groups, and then assigned to observed households using these characteristics.11For each of the 12 categories, the target replacement rate model also calculates different targets by DB coverage and homeownership. The values of the 12 targets that are matched to observed households are the weighted averages across DB coverage and homeownership. Under the new method, much richer household characteristics are used for calculating target rates, allowing the projected replacement rates to be matched to hundreds of targets, which yields more accurate estimates. Specifically, matching is now based on much more fine-grained income groups and households’ actual DB coverage and homeownership status.
Incorporates the Earned Income Tax Credit (EITC) in replacement rates. The old method did not include the EITC in the calculation of pre-retirement income. However, the EITC is important for low-income households during their working years, so the new method includes it to better capture the income these households will need to replace in retirement.
Other changes include:
- Annuity factors used to annuitize projected wealth now better reflect the levels and trends observed in the annuity market.
- Reverse mortgage calculations now use updated interest rate assumptions and principal limit factor tables.
- Key model assumptions and inputs, such as wage growth, interest rates, inflation, and mortality tables are updated.
- The NRRI codebase has been largely moved from Stata and Excel spreadsheets to Python, allowing for more flexible model development, improved computation, and easier maintenance.
The New National Retirement Risk Index
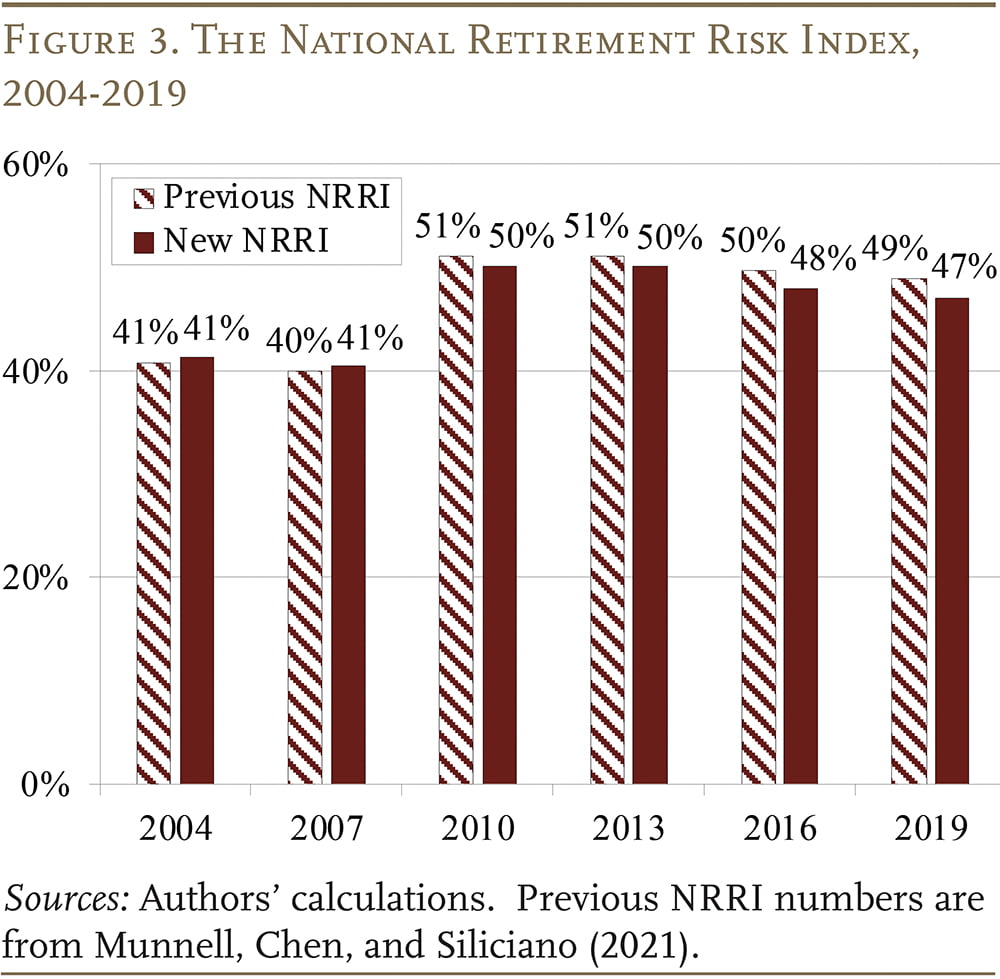
Despite the extensive changes in methodology, the overall level and time pattern of the Index remain the same as before (see Figure 3). Thus, the most important finding still holds: about half of working-age households will not be able to maintain their pre-retirement living standard. Moreover, the pattern continues to reflect the health of the economy. The Index increased substantially from 2007 to 2010 during the Great Recession, and then declined a bit from 2013 to 2019 as the economy enjoyed low unemployment, rising wages, strong stock market growth, and rising housing prices. These improvements were modest due to some countervailing longer-term trends – such as the gradual rise in Social Security’s Full Retirement Age (FRA) and the continued decline of interest rates – which made it more difficult for households to achieve retirement readiness.
Patterns by Household Type
In addition to the time pattern, the NRRI patterns by age, income, and wealth are also generally consistent with our previous publications.
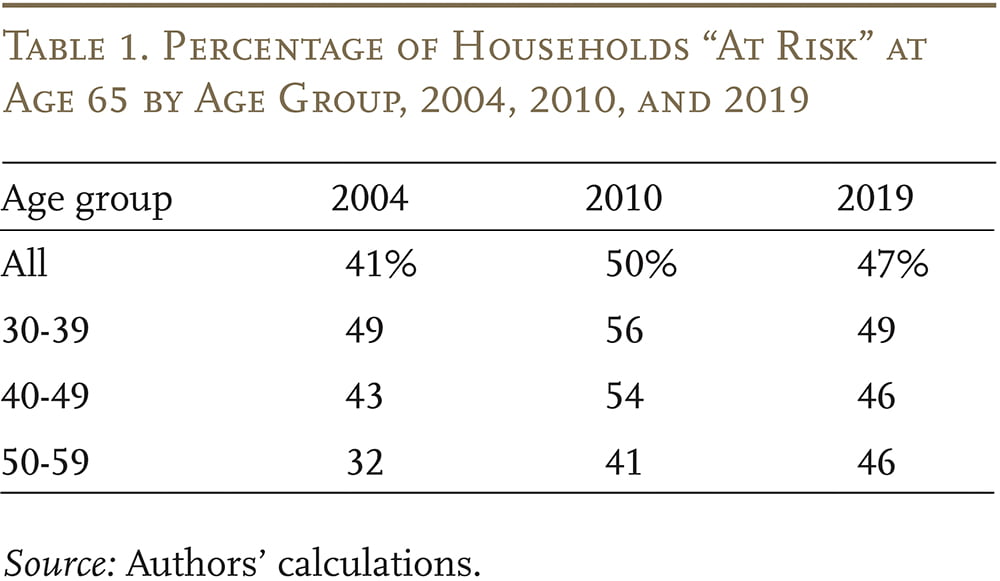
Age. The NRRI in 2004 shows a large discrepancy in retirement readiness by age group, which reflects the dramatic changes in the retirement landscape such as the shift of pension coverage from DB to DC plans, rising life expectancy, and the increase in the FRA (see Table 1). As the trends for these underlying factors stabilized over time and their impact fully materialized, the age discrepancy in the NRRI has narrowed.12Without dramatic future changes, the age pattern of the Index is expected to be increasingly driven by the timing of economic fluctuations and shocks during workers’ careers.
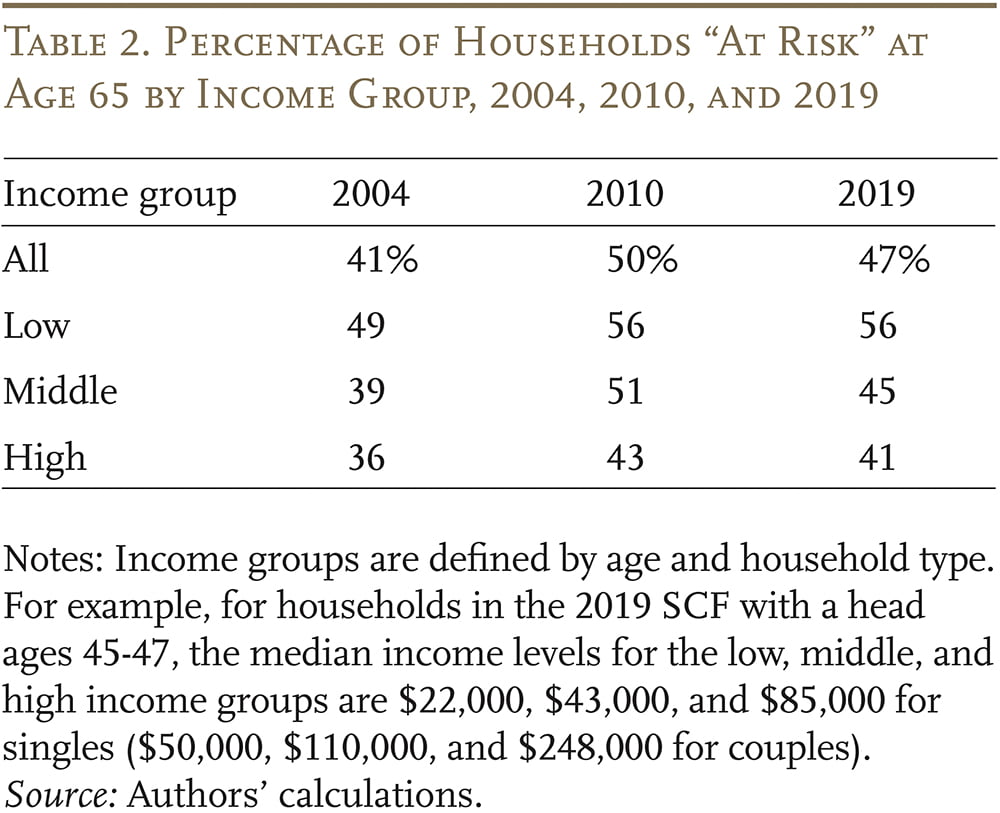
Income. Households’ retirement preparedness in all income groups was heavily affected by the Great Recession (see Table 2). The middle and the highest thirds saw significant improvement from 2010-2019 due to rebounding housing and equity prices. In contrast, households in the bottom third saw virtually no improvement as they are less likely to own a house and participate in DC plans, and have few financial assets. In addition, the rise in wage growth for lower-income workers, which is good news generally as it improves their current standard of living, leads to lower projected Social Security replacement rates due to the progressive benefit formula.13Note that an increase in earnings does not necessarily lead to improved retirement preparedness in the NRRI, because it also increases the pre-retirement income households need to replace. Unless households increase their savings rates or enjoy higher-than-expected wealth growth, their retirement readiness may not improve, although they do enjoy an improved pre-retirement standard of living from an increase in earnings. The increase in the FRA also has a particularly large impact on low-income households, who depend almost entirely on Social Security for retirement income.
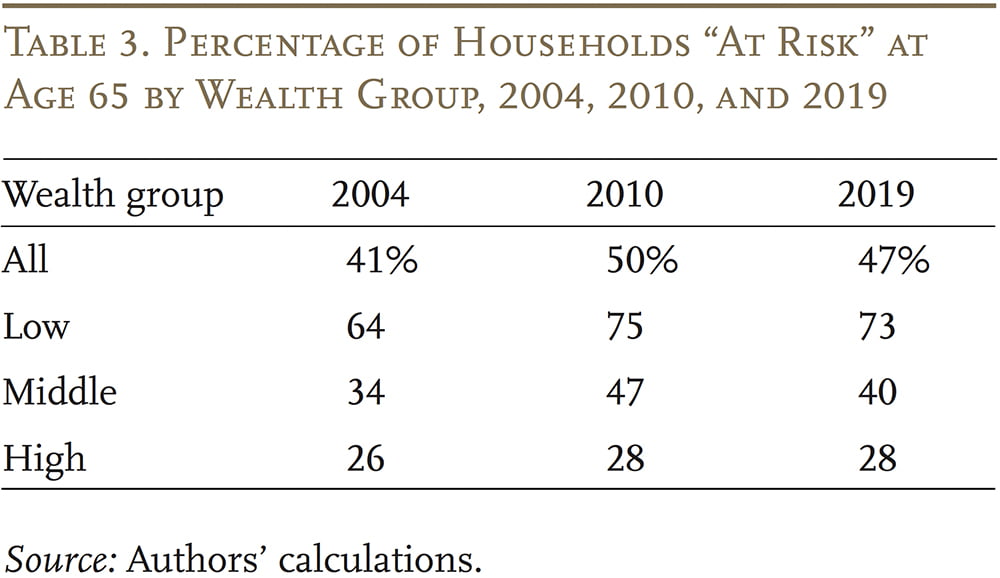
Wealth. When viewed by wealth, households’ retirement preparedness generally shows a similar pattern. The discrepancy between the top and bottom wealth groups, though, is much larger than those by income (see Table 3), reflecting the fact that wealth inequality is more severe than income inequality.
Conclusion
Since its inception, the NRRI methodology has received many improvements and updates, which enhance the projections of households’ wealth and replacement rates at retirement and the estimations of the target replacement rates. With the latest upgrades, the NRRI can more accurately measure the retirement preparedness of working-age households and evaluate the impact of economic and policy factors on retirement security.
After recalculating the NRRI using the most updated methodology, the bottom line from our previous studies still holds: about half of today’s households will not have enough retirement income to maintain their pre-retirement standard of living, even if they work to age 65 and annuitize all their financial assets, including the receipts from a reverse mortgage on their homes. The robustness of the results confirms the retirement saving issue faced by today’s working-age households, and that we need to fix our retirement system so that employer plan coverage is universal. Only with continuous coverage will workers be able to accumulate adequate resources to maintain their standard of living in retirement.
References
Chen, Anqi, Wenliang Hou, and Alicia H. Munnell. 2020. “Why Do Late Boomers Have So Little Retirement Wealth?” Issue in Brief 20-4. Chestnut Hill, MA: Center for Retirement Research at Boston College.
Munnell, Alicia H., Anthony Webb, and Luke Delorme. 2006. “Retirements at Risk: A New National Retirement Risk Index.” Chestnut Hill, MA: Center for Retirement Research at Boston College.
Munnell, Alicia H., Anqi Chen, and Robert L. Siliciano. 2021. “The National Retirement Risk Index: An Update from the 2019 SCF.” Issue in Brief 21-2. Chestnut Hill, MA: Center for Retirement Research at Boston College.
Munnell, Alicia H., Wenliang Hou, and Geoffrey T Sanzenbacher. 2018. “National Retirement Risk Index Shows Modest Improvement in 2016.” Issue in Brief 18-1. Chestnut Hill, MA: Center for Retirement Research at Boston College.
U.S. Bank of Governors of the Federal Reserve System. Survey of Consumer Finances, 1983-2019. Washington, DC.
Endnotes
- 1The original methodology was described in Munnell, Webb, and Delorme (2006).
- 2The Index does not include income from work in retirement, since labor force participation declines after age 65.
- 3While inflation-indexed annuities are not widely used by consumers, they provide a convenient metric for calculating the lifetime income that can be obtained from a lump sum. And while inflation-indexed annuities provide a smaller initial benefit than nominal annuities, they protect a household’s purchasing power over time against the erosive effects of inflation.
- 4The level of replacement required for smoothing consumption before and after retirement will vary by type of household. For example, low-income households get most of their retirement income from Social Security and therefore need little saving before retirement. The result is that they get little break from no longer having to save in retirement. Similarly, low-income households pay little in taxes, so they receive little in the way of tax saving in retirement. Thus, low-income households need a higher replacement rate in retirement.
- 5It is important to note that the practical meaning of “at risk” differs by a household’s level of income. For example, at-risk households with very low income may have trouble affording life’s basic necessities. In contrast, at-risk households with high income are not in danger of falling into poverty. However, they do face the prospect of a difficult adjustment that may require them to lower their expectations of their retirement lifestyle.
- 6The previous approach involves two steps: it first estimates average growth paths of wealth-to-income ratios across ages using linear regressions, which is done for the bottom, middle, and top third of the income distribution separately; it then adjusts the average wealth growth paths for each household based on their current wealth relative to the average level and projects the wealth-to-income ratio to age 62 using the adjusted growth paths.
- 7The previous method imposes restrictions on the resulting projected distributions, which can partially reduce the bias. However, the rise in wealth inequality over time makes it increasingly difficult to rely on this approach.
- 8For each type of wealth, the new method breaks down the distribution of wealth-to-income ratio within a given age group into 20 percentile groups and calculates the median value of each group. Then, 20 wealth growth paths are constructed by connecting the median values from corresponding percentile groups across age. For example, the fifth path consists of the median wealth-to-income ratios of the fifth percentile group (20th-25th percentiles) in all age groups. The paths are constructed for the low-, middle-, and high-income groups separately.
- 9The median ratios of DC wealth to income near retirement (ages 60~62) for these three birth cohorts are 0.75, 1.25, and 1.45 respectively. Recent studies found an unexpected decline in the 401(k)/IRA wealth for Late Boomers compared to earlier cohorts, but the main reasons for the decline are still not clear (Chen, Hou, and Munnell 2020). The Center will keep tracking this trend and incorporate new findings into the NRRI as warranted.
- 10See Munnell, Hou, and Sanzenbacher (2018).
- 11For each of the 12 categories, the target replacement rate model also calculates different targets by DB coverage and homeownership. The values of the 12 targets that are matched to observed households are the weighted averages across DB coverage and homeownership.
- 12Without dramatic future changes, the age pattern of the Index is expected to be increasingly driven by the timing of economic fluctuations and shocks during workers’ careers.
- 13Note that an increase in earnings does not necessarily lead to improved retirement preparedness in the NRRI, because it also increases the pre-retirement income households need to replace. Unless households increase their savings rates or enjoy higher-than-expected wealth growth, their retirement readiness may not improve, although they do enjoy an improved pre-retirement standard of living from an increase in earnings.


Yin, Yimeng, Anqi Chen, and Alicia H. Munnell. 2023. "The National Retirement Risk Index: Version 2.0" Issue in Brief 23-10. Chestnut Hill, MA: Center for Retirement Research at Boston College.