
Can Equity Investments Help Social Security’s Finances?

The brief’s key findings are:
- The Cassidy-Kaine plan – which would borrow to create an investment fund and to cover Social Security shortfalls for 75 years – is unlikely to work.
- Our analysis shows that the most common outcome would leave the taxpayers with a large debt, even under optimistic return assumptions.
- Alternatively, equity investments could help Social Security’s finances if paired with a tax increase or benefit cut that restores solvency.
- But the window of opportunity is closing; waiting until 2034 to introduce equities would be too late to offer a permanent fix.
Introduction
Social Security faces a well-documented financing challenge. The combined Old-Age, Survivors, and Disability Insurance trust fund is projected to exhaust its assets within the decade, after which incoming revenues can cover only about 80 percent of scheduled benefits. Policymakers from both sides of the aisle have been reluctant to raise taxes or cut benefits. Noting the lack of political appetite for tough choices, Senators Bill Cassidy (R-LA) and Tim Kaine (D-VA) have proposed a third option – borrowing $1.5 trillion to create a separate investment fund that would be invested in equities and other risky assets for 75 years. At the end of the period, the investment proceeds could repay the Treasury with interest, and the remainder could offset the $25.1 trillion in borrowing required over the 75 years to close the gap between Social Security revenues and scheduled benefits. The questions are: 1) How much of the $26.6 trillion debt can the Cassidy-Kaine investment fund offset?; and 2) What would be the impact of first restoring balance and then investing the trust fund in equities?
This brief, which is based on a new paper, evaluates the two approaches to including equities in Social Security’s finances.1 The metric for success for the Cassidy-Kaine proposal is the extent to which net gains from the separate investment fund can offset the borrowed $26.6 trillion. In the restore-solvency-first approach, the metric is the size of the trust fund relative to annual outlays. In both cases, the analysis provides a probabilistic range of outcomes based on various assumptions about equity returns.
Background
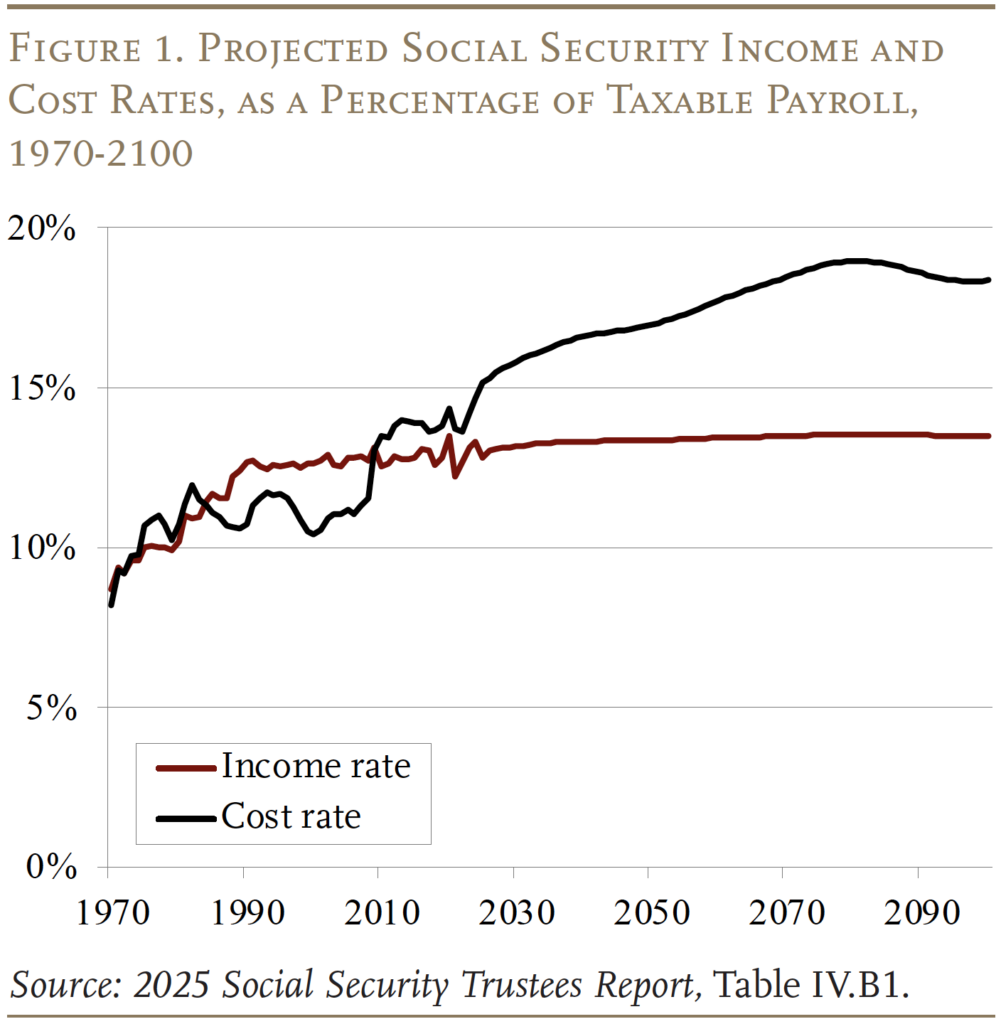
This is not the first time that policymakers have suggested investing in equities to address Social Security’s financial shortfall. In 1983, the combination of a long-run deficit and the immediate prospect of falling short led Congress to enact changes that raised revenues and reduced benefits, which restored balance for the next 75 years. By the 1990s, however, significant long-term imbalances had re-emerged (see Figure 1).
In response, President Clinton asked the 1994-1996 Social Security Advisory Council to consider options to achieve long-term solvency. The Council could not agree on a single proposal, so its members advanced three different plans. Interestingly, all three included some form of investment in corporate equities. Two of the Advisory Council’s three plans proposed equity investment in individually held private accounts, while the third plan recommended that a fraction of the trust fund assets be invested in equities – an approach that could be adopted within Social Security’s existing structure.2
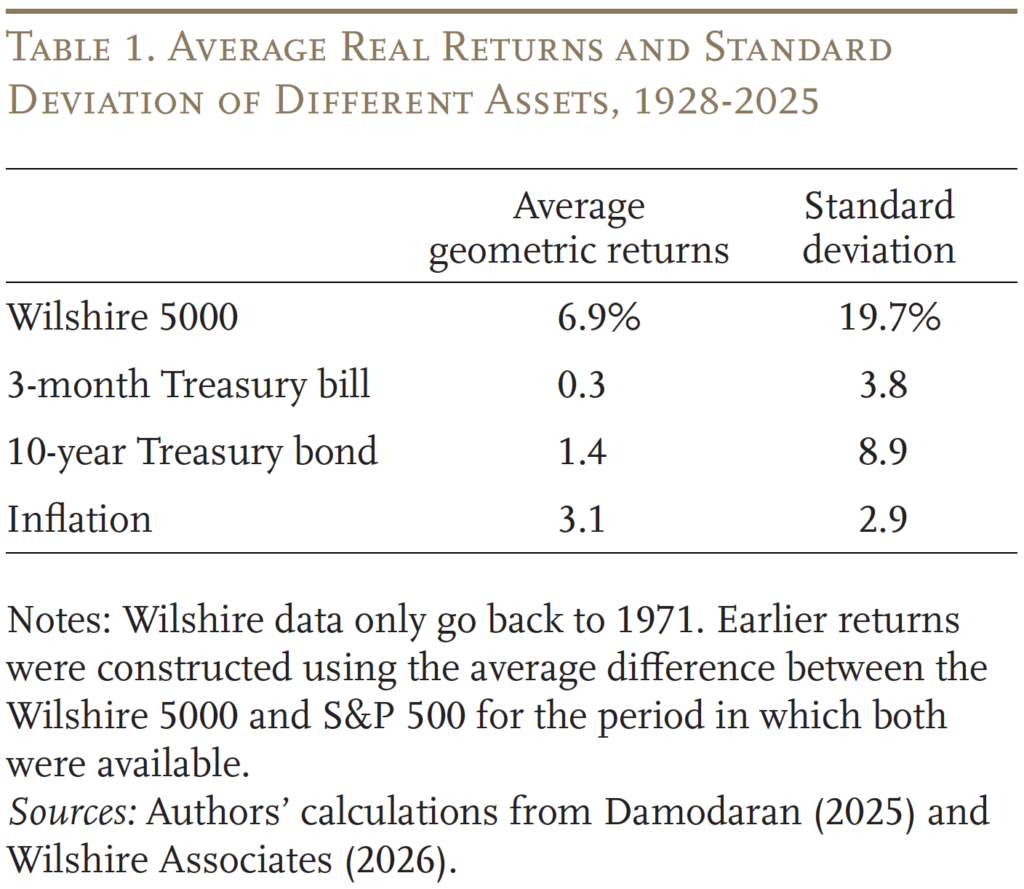
The attraction of equity investment is that it has a higher expected rate of return relative to safer assets, such as Treasury bills or bonds (see Table 1). Of course, equities also carry greater risk, as evidenced by the higher standard deviation in returns historically.
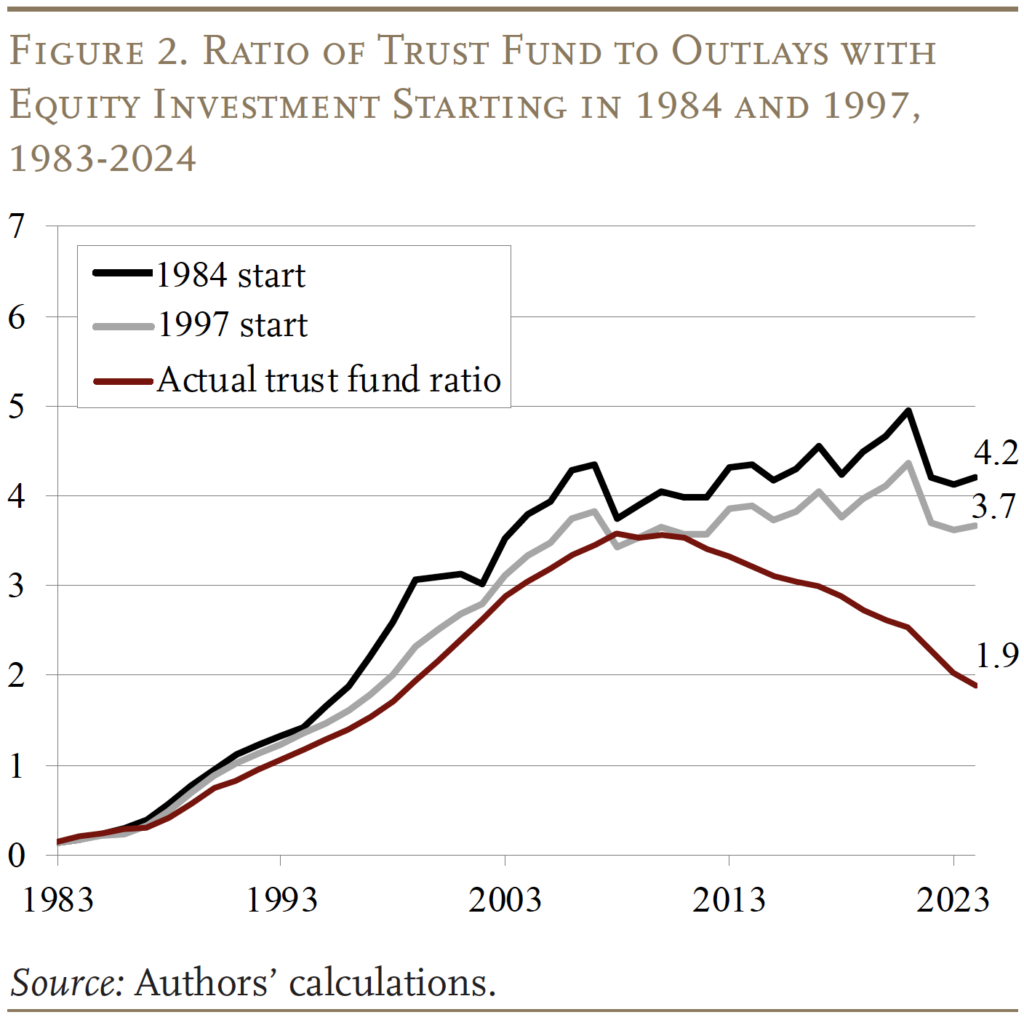
Despite the greater risk associated with equities evidenced by two major stock market slumps and the 2008 financial crisis, investing a portion of Social Security’s trust fund in equities in 1984 – after the 1983 reforms – or in 1997 – after the 1994-1996 Advisory Council – would have increased trust fund balances substantially (see Figure 2). If investment had begun in 1984, the ratio of trust fund assets to outlays in 2024 would have been 4.2 compared to an actual ratio of 1.9.3 (In dollars, the trust fund in 2024 would have held $6.2 trillion instead of $2.8 trillion.) Even if equity investments had started in 1997, the trust fund ratio in 2024 would have been 3.7.4
Despite these advantages, skeptics have questioned the wisdom of direct government investment in the stock market. Some worry that Social Security stock holdings might become large enough to threaten the stability of the market.5 But the results in Figure 2 assume that investments were capped at 40 percent of Social Security assets, so the trust fund would own less than 7 percent of the market today.6 Another concern is that substantial trust fund ownership might involve undue government influence over corporate decision-making. But the Canada Pension Plan, U.S. National Railroad Retirement Investment Trust, and U.S. Thrift Savings Plan are examples of how government equity investments can be achieved with limited government intervention.
The real problem today is that investing assets in equities requires a large trust fund, and our trust fund is rapidly trending toward zero. Congress could take one of two options to build a large investable base. One option is the Cassidy-Kaine proposal, which involves creating a separate investment fund through $1.5 trillion in debt, investing it in equities, letting it grow for 75 years, and borrowing an additional $25.1 trillion to pay benefit gaps in the meantime, producing a total of $26.6 trillion in new borrowing.7 At the end of 75 years, the fund will pay the Treasury back and use any additional assets to reduce the debt accrued over the 75 years. The other option is to immediately eliminate the 75-year deficit (by raising taxes, reducing benefits, or some combination of the two), rebuild the trust fund, and invest a portion of those assets in equities. The analysis below explores the likely impact of each of these options.
Methods and Data
A Monte-Carlo model is used to simulate the distribution of outcomes of introducing equities through either: 1) adopting Cassidy-Kaine; or 2) restoring solvency and rebuilding the trust fund. This modeling is necessary because equities are risky assets, and the outcome at any point could differ substantially from the assumed return. The measure of success for the Monte-Carlo analysis differs between the two options. For the Cassidy-Kaine proposal, success is measured in terms of the percentage of the $26.6 trillion borrowing that would be offset by the separate investment fund. For the restoring-solvency approach, success is measured in terms of the size of the trust fund relative to Social Security’s annual outlays.
Modeling Social Security finances requires data on the income and cost components of the trust fund. These components for the 75-year projection horizon are reported in the 2025 Social Security Trustees Report.8 Macroeconomic variables, such as real wages, demographic data, and the number of covered workers and beneficiaries, also come from the Trustees.9
A key assumption for the Monte-Carlo10 analysis is how much fund assets will grow over the next 75 years, which depends on the assumed rate of return on equities. The Cassidy-Kaine proposal assumes a nominal return of 8.9 percent – roughly in line with the historical performance of equities.11 This analysis is based on real rates, which involves subtracting the Social Security Trustees’ projected inflation rate of 2.4 percent from the Cassidy-Kaine 8.9 percent – yielding a real rate of 6.5 percent. This number serves as the starting point for the analysis.
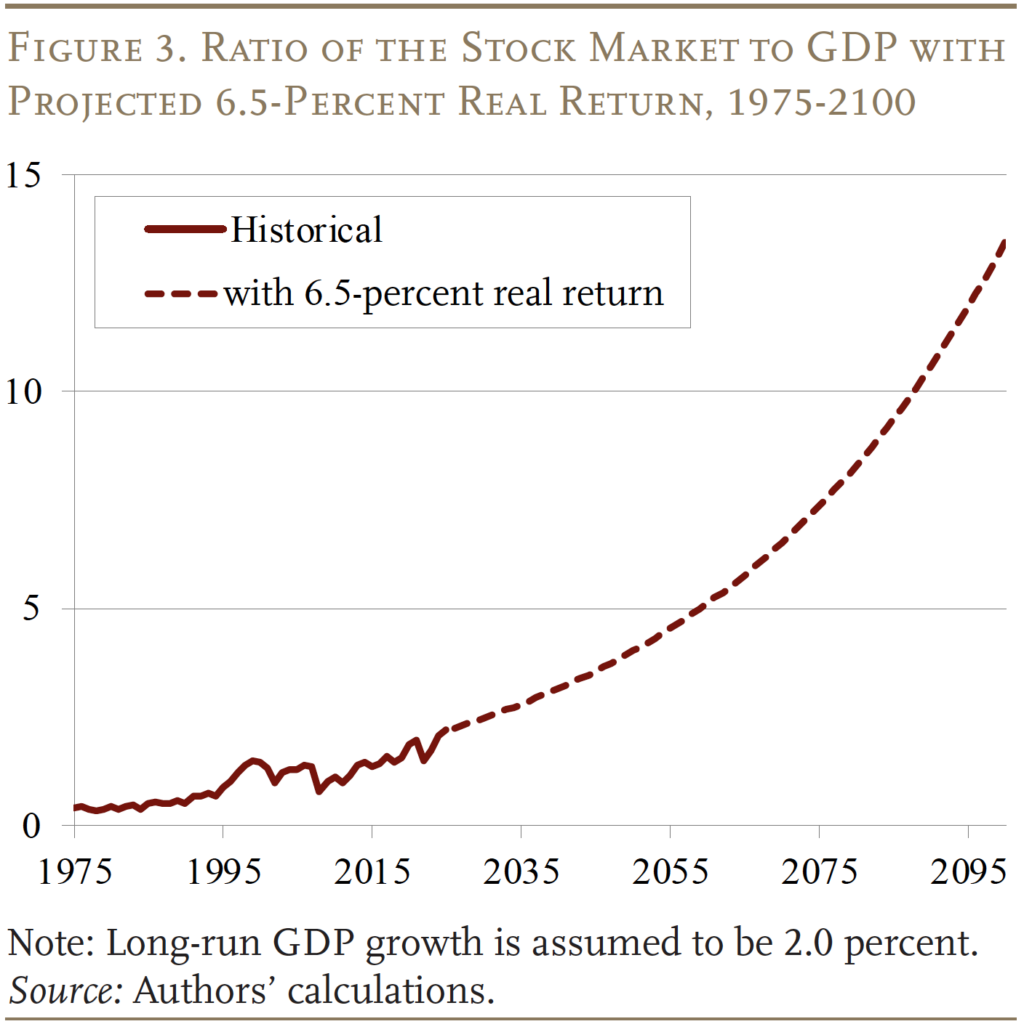
Applying a 6.5-percent return to today’s high stock prices, however, produces an astoundingly high value of the stock market relative to GDP over the next 75 years (see Figure 3).12 Today, that number is about 2 – that is, the value of the stock market is twice GDP. By 2100, that number rises to over 13, which means that the stock market value would be more than 13 times GDP.
Not surprisingly, many financial experts argue that the returns on stocks in the future will be lower than in the past. Indeed, a number of large financial services companies are projecting dramatically lower returns, at least for the next 15-30 years (see Table 2).
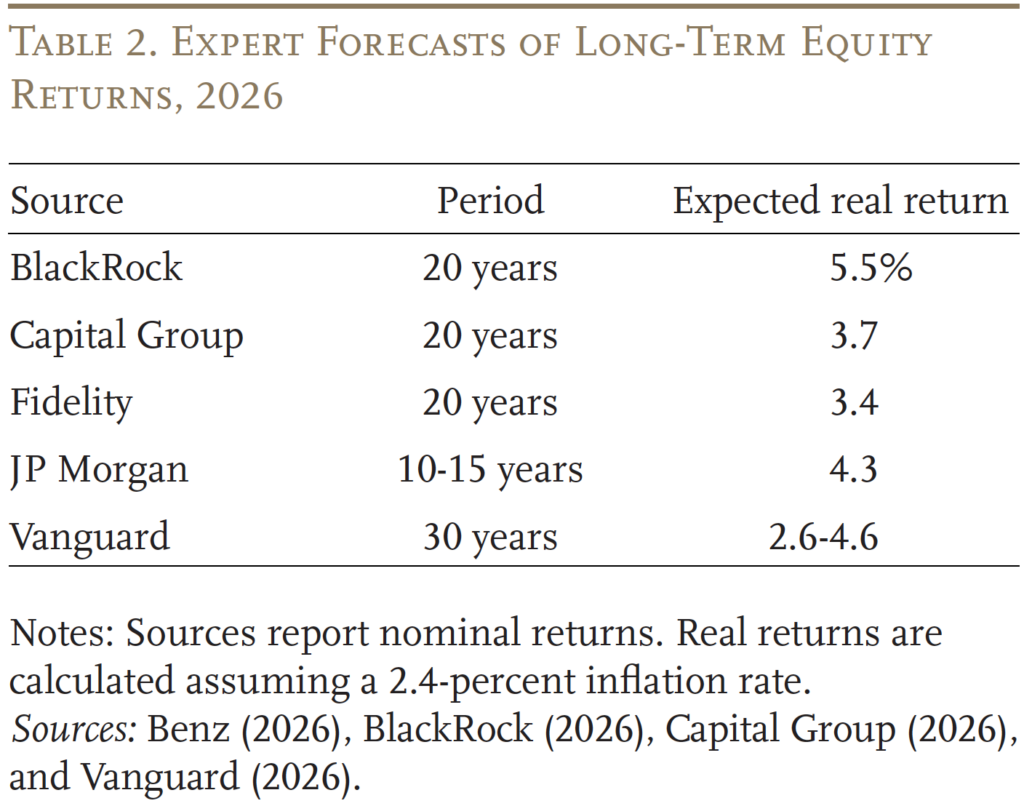
Lower future returns are also consistent with the predictions of a prominent economic growth model.13 This model says, in a steady state, the return on equities will equal the adjusted dividend yield plus the increase in stock prices, where prices rise at the rate of GDP. The output from that model implies a 4.0-percent real return on equity, which is used for a second round of Monte-Carlo simulations.
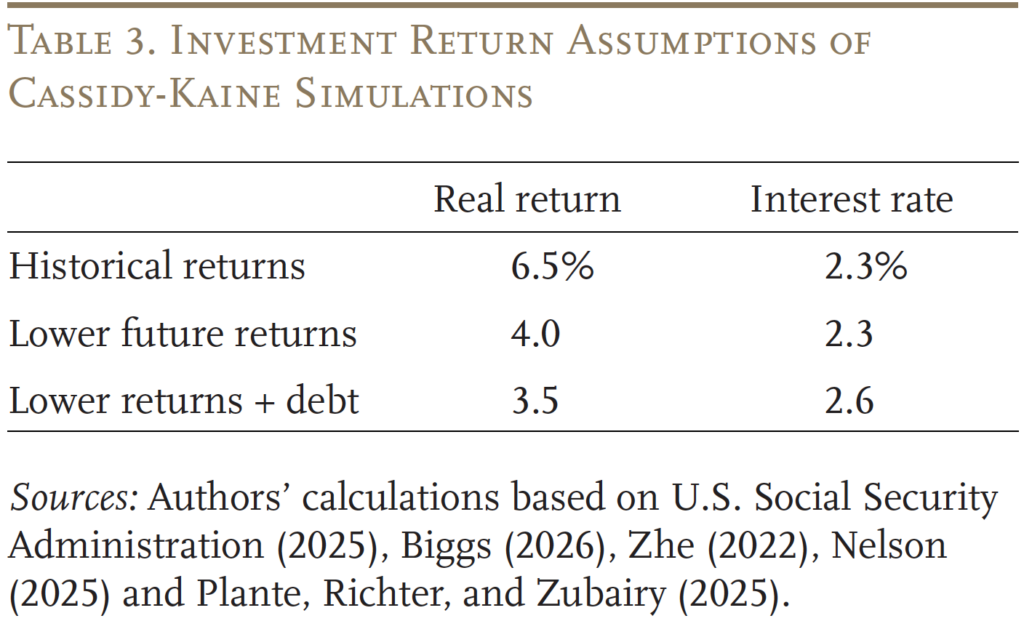
For the Cassidy-Kaine plan, one further exercise is necessary to incorporate the possible effects of almost doubling the nation’s debt. A higher debt-to-GDP ratio increases interest rates, which would directly lower equity returns through higher discount rates. Equity returns would also be lower due to lower GDP growth.14 For this exercise, the debt effect is assumed to increase interest rates by 0.3 percent and lower equity returns by 0.5 percent
(see Table 3).15
Results for Cassidy-Kaine Proposal
Calculating the extent to which the Cassidy-Kaine proposal could be successful involves comparing the present discounted value of the $1.5 trillion investment fund in the 75th year – under the alternative equity return assumptions – with the $26.6 trillion of borrowing. A Monte-Carlo analysis with 10,000 simulations shows the range of outcomes after 75 years around an assumed equity-return and interest-rate assumption.
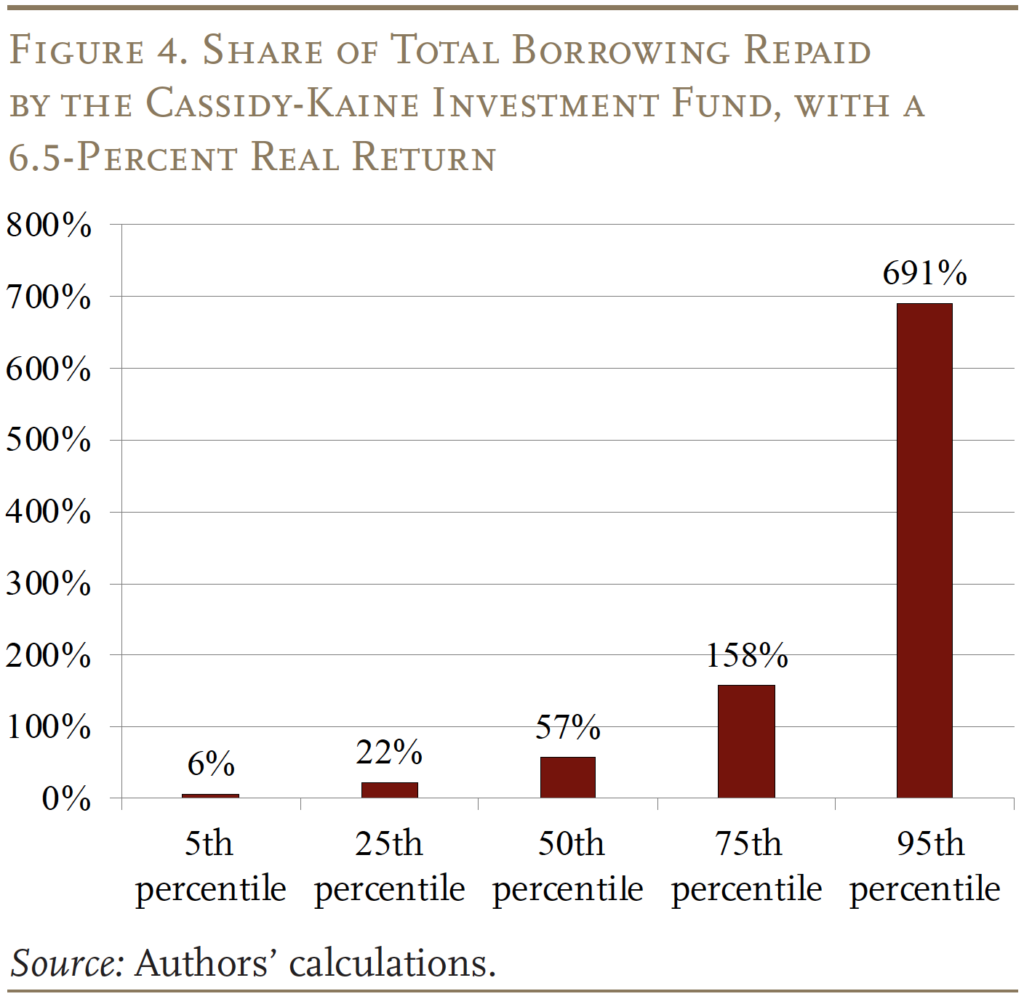
The first assumption is that equity returns equal the historical real rate of 6.5 percent and that the interest rate is 2.3 percent. A simple calculation suggests the exercise should just about break even: the $1.5 trillion investment fund would grow to $30.6 trillion – netting $4 trillion after repaying the Treasury. After incorporating the volatility in equity returns, however, the results show that the gamble does not always pay off. For example, at the 50th percentile of outcomes, the trust fund assets can offset only 57 percent of the 75-year borrowing (see Figure 4). In fact, the gamble only works at the 64th percentile of outcomes.16 That means in 64 out of 100 outcomes, the investment fund will not earn enough to pay back all the borrowing.
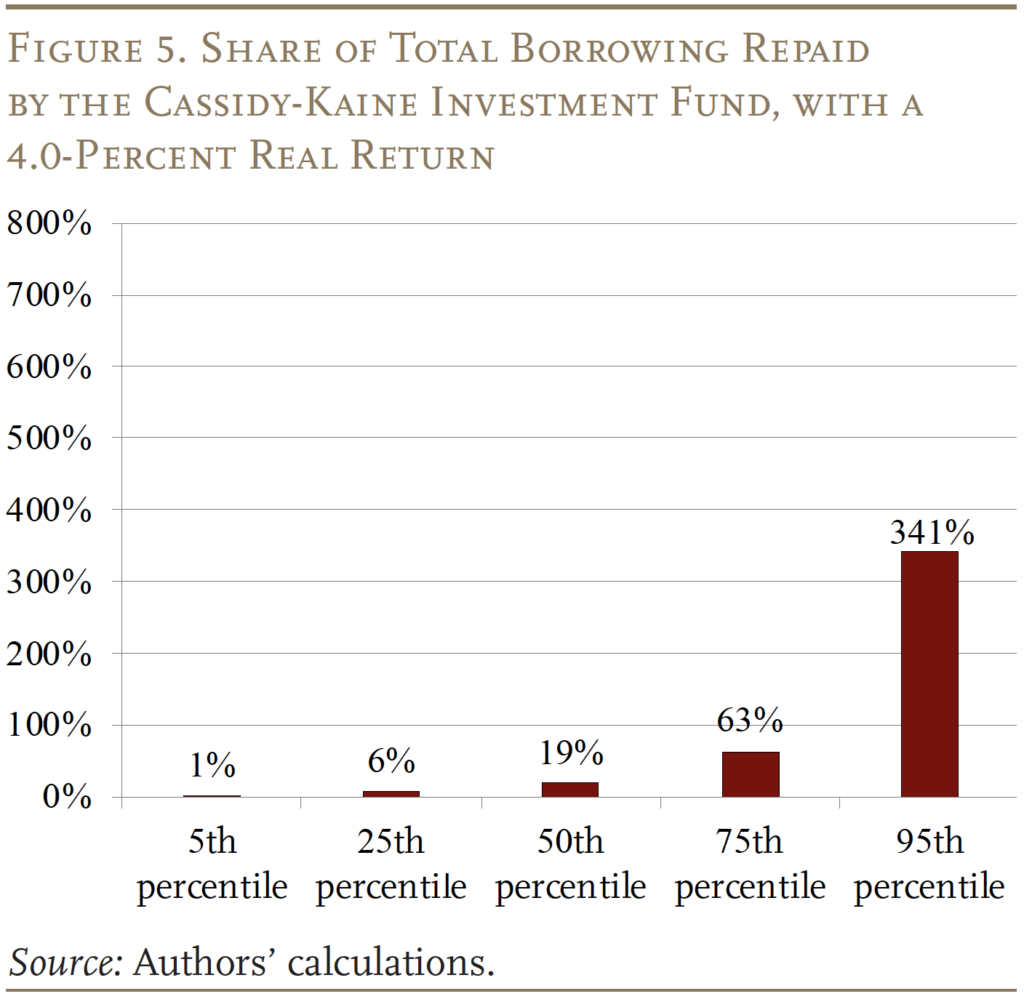
As discussed, many argue that equity returns will be lower in the future than today. Therefore, a second Monte Carlo simulation assumes a real return on equities of 4.0 percent. In this scenario, the outcome would be expected to fail on average. The $1.5-trillion investment fund would grow to only $5.2 trillion in present value terms, falling far short of the $26.6 trillion in borrowing. Indeed, at the 50th percentile, the investment fund can offset only 19 percent of the $26.6 trillion (see Figure 5). Indeed, the detailed results show that a full offset is possible only at the 83rd percentile, suggesting the plan would work only 17 out of 100 times.
As discussed above, returns could be even lower because doubling our national debt likely has implications for equity returns and interest rates. The quick calculation indicates that the $1.5-trillion investment fund would grow to only $3.6 trillion – far short of the $26.6 in borrowing. Indeed, the Monte Carlo simulation shows that even at the 95th percentile, the trust fund would be able to offset only 21 percent of the borrowing (see Figure 6).
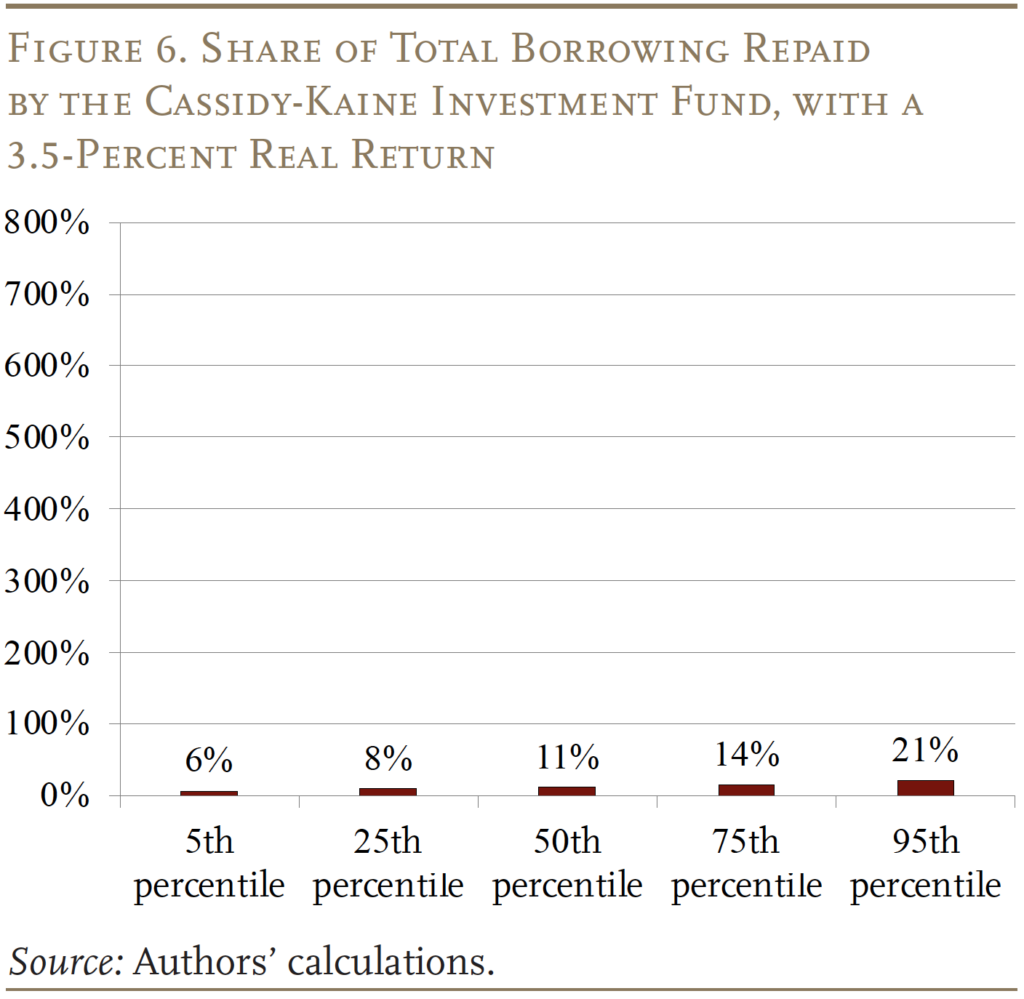
The bottom line from these simulations is that even if real equity returns continue at the high historical level of 6.5 percent for the next 75 years, the Cassidy-Kaine proposal would only pay back all borrowing about two-fifths of the time. Other return assumptions produce much more negative results. As a result, the most likely outcome is that in the 75th year, the government will end up with a big pile of debt, requiring large interest payments. These far-from-sanguine results, however, do not necessarily mean equities should not be part of a broader Social Security reform package.
Results from Including Equities in a Solvency Plan
While many researchers and policymakers have suggested, as part of a solvency plan, adding equities to Social Security’s trust fund, these recommendations were made when the ratio of trust fund assets to outlays was high and rising. In 2024, trust fund assets were $2.7 trillion, less than 2 times annual outlays, and the trust fund is heading to zero by 2034. The question is whether, in this context, equities could still improve trust fund finances, reducing the need for future tax increases or benefit cuts.
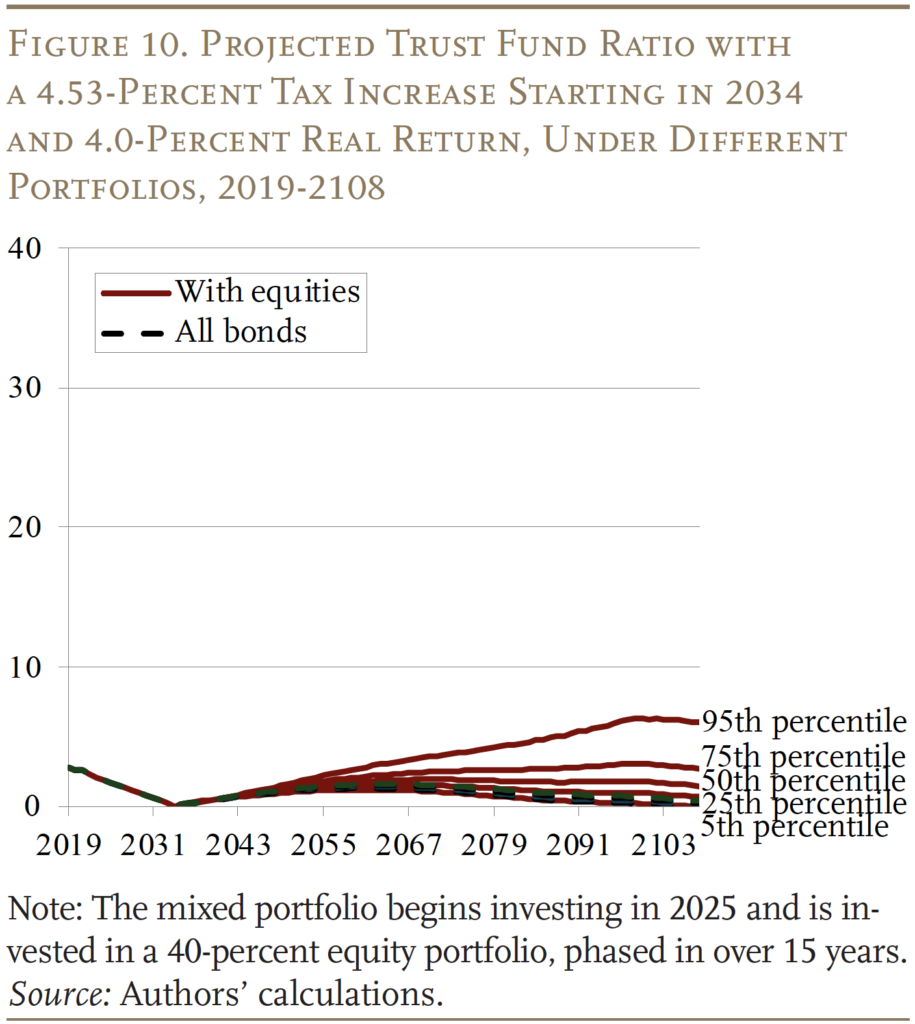
For this exercise, solvency is achieved by raising the payroll tax rate – of course, the results would be similar if the financing gap were closed through a benefit cut or a combination of the two. The size of the tax increase depends on when the action is taken. If enacted immediately, the 2025 Social Security Trustees Report says the required tax increase would be 3.82 percent; if action were delayed until 2034, the required increase would be 4.53 percent. In addition to considering two action dates, the analysis uses two of the alternative returns on equities – 6.5 percent and 4.0 percent. Equity allocations are phased in over 15 years and are capped at 40 percent of the trust fund.17
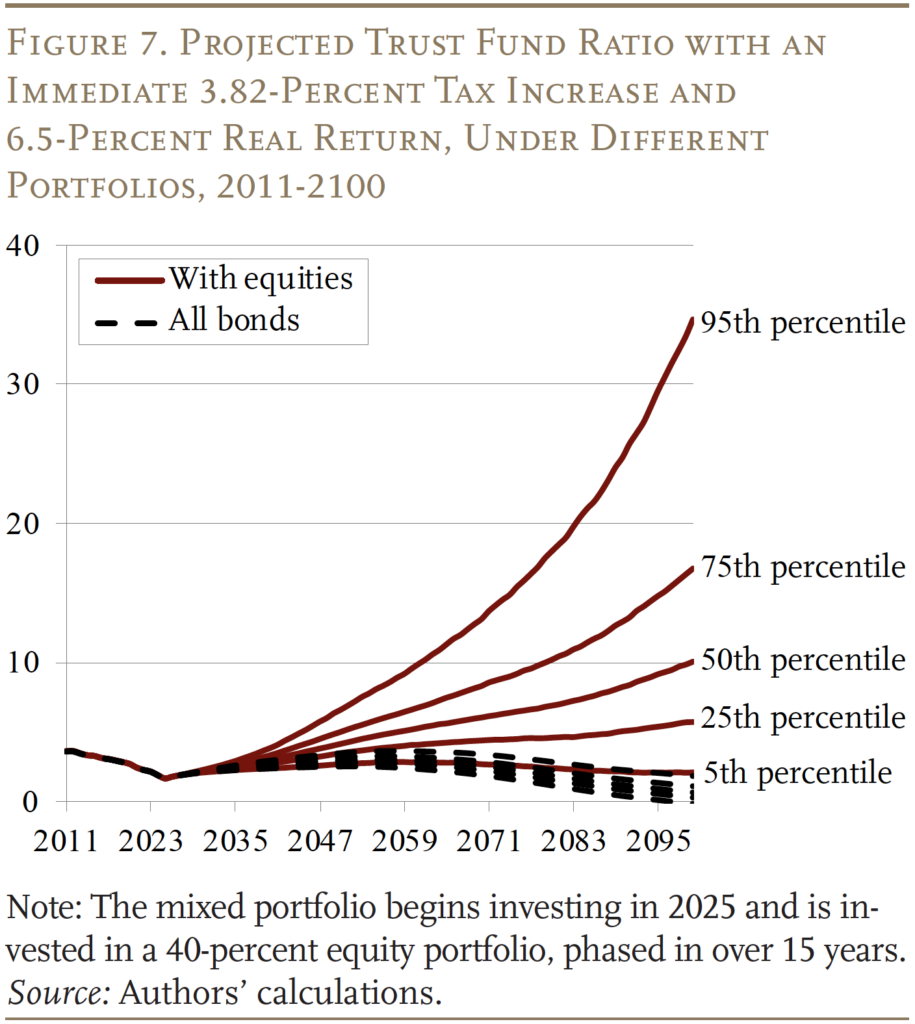
The first two simulations assume that action is taken immediately. In the first instance, the real return on equity is 6.5 percent. At the 50th percentile of outcomes, the trust fund ratio would be 10.1 in 75 years compared to 0.7 if the trust fund were invested solely in special issue bonds as it is currently (see Figure 7). Even at the 5th percentile, the trust fund could remain solvent indefinitely, reducing the need to raise taxes or cut benefits in the future.
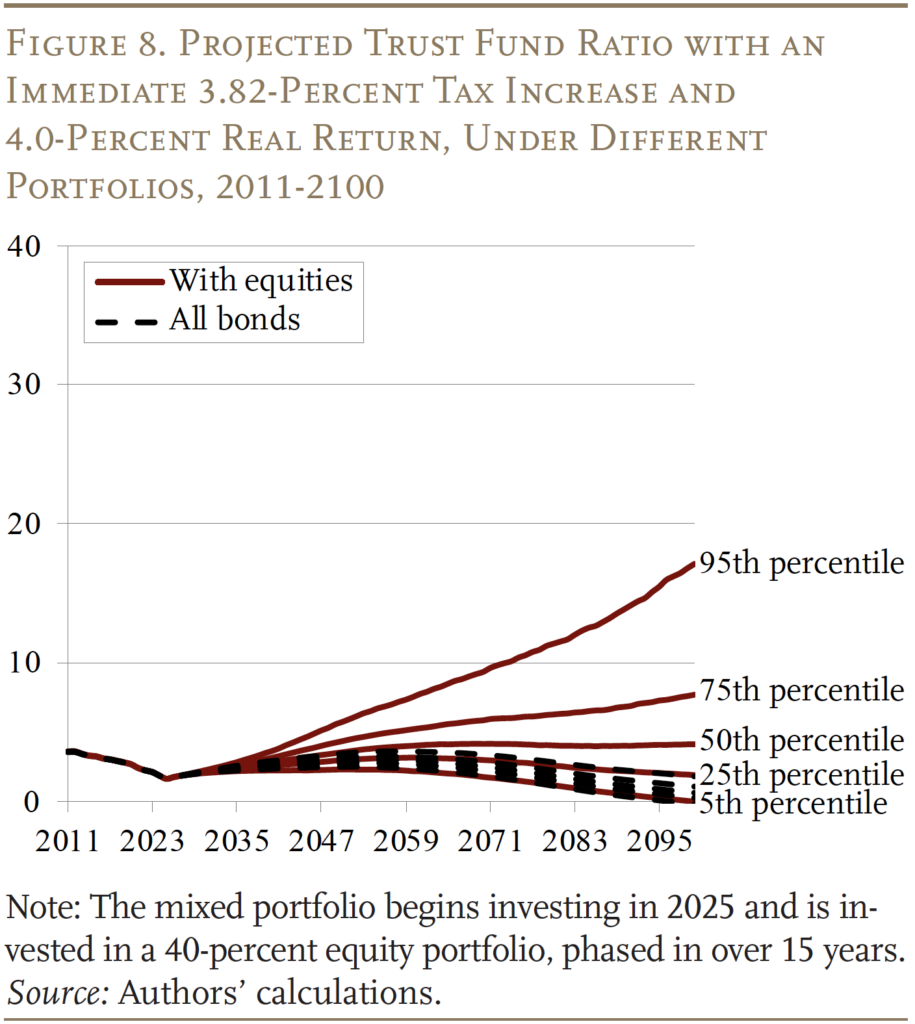
Interestingly, introducing equities into the trust fund is useful even if the real average rate on equities is 4.0 percent rather than 6.5 percent.18 If action is taken immediately, the influx of equities – at the 50th percentile of outcomes – causes the ratio of trust fund assets to outlays to stabilize at around 4, and could pay benefits without further benefit cuts or tax increases (see Figure 8).
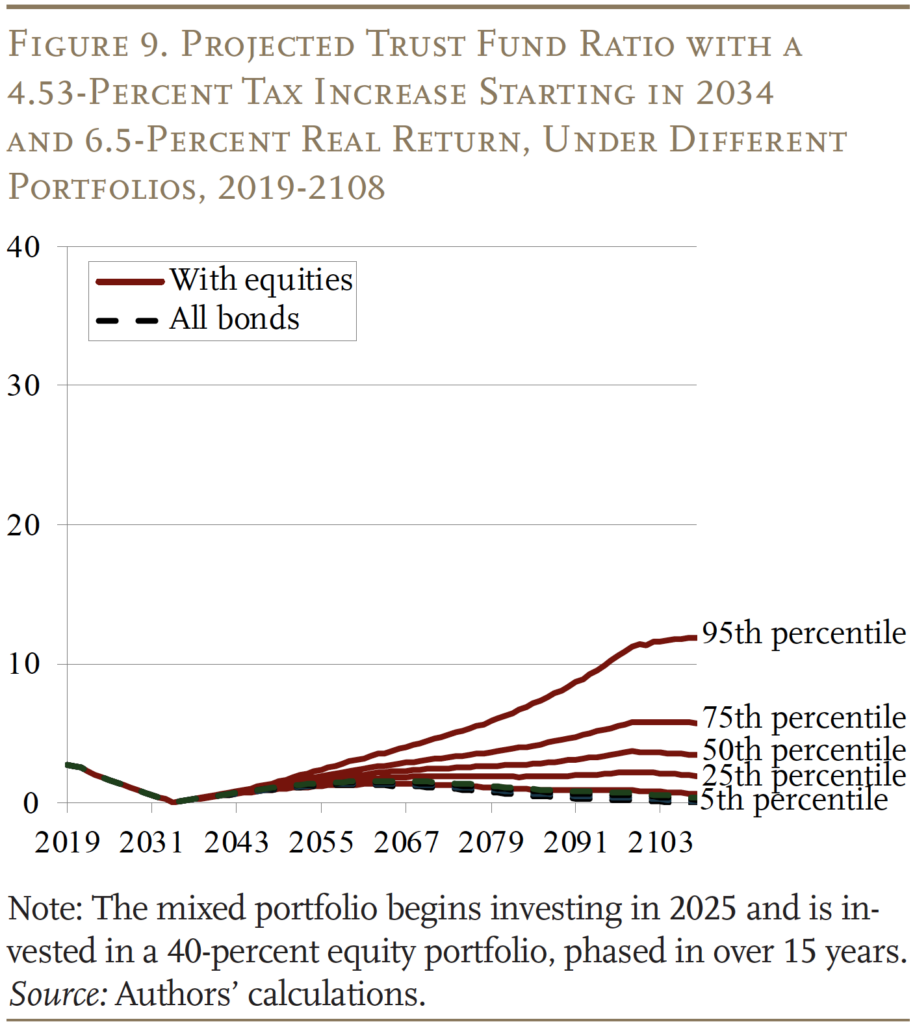
The second two simulations assume that action is delayed until 2034. Assuming a 6.5-percent real return on equities, the trust fund ratio would only be 3.4 at the 50th percentile of outcomes (see Figure 9).19 At the 25th percentile, the trust fund would also not be large enough to remain solvent indefinitely, so policymakers would once again have to consider further tax increases or benefit cuts to keep the program solvent going forward.
Of course, if median returns end up being around 4.0 percent real, the story is even worse (see Figure 10). Even the 50th percentile of outcomes, the trust fund would not be able to remain solvent indefinitely.
Conclusion
The Cassidy-Kaine proposal assumes that borrowing to create an investment fund and investing in equities could help solve Social Security’s financing problem. The analysis of the proposal, however, shows that it is more likely to leave the government with a big pile of debt in the 75th year, requiring large interest payments.
While borrowing to invest is not the silver bullet for solving Social Security’s financing problems, introducing equities can help the program’s finances if coupled with a reform package that restores solvency. If Congress enacted an immediate tax increase (or benefit cut) that closed the long-run financing gap, then a 40-percent allocation to equities could reduce the need for future tax increases or benefit cuts. However, the window of action is limited. If Congress waits to implement the same plan in 2034, it would likely not provide a permanent fix.
For policymakers, the implication is straightforward. If equity investment is to play any constructive role in Social Security reform, it must be considered early, alongside a comprehensive solvency package that restores balance between revenues and benefits and rebuilds reserves.
References
Benz, Christine. 2026. “Experts Forecast Stock and Bond Returns: 2026 Edition.” Article. Chicago, IL: Morningstar.
Biggs, Andrew G. 2026. “Stress-Testing the Cassidy-Kaine ‘Big Idea’ Social Security Plan.” Article. Washington, DC: American Enterprise Institute.
BlackRock. 2026. “Capital Market Assumptions.” New York, NY.
Burtless, Gary, Anqi Chen, Wenliang Hou, Alicia H. Munnell, and Anthony Webb. 2016. “How Would Investing in Equities Have Affected the Social Security Trust Fund?” Working Paper 2016-6. Chestnut Hill, MA: Center for Retirement Research at Boston College.
Capital Group. 2026. “2026 Capital Market Assumptions.” Los Angeles, CA.
Cassidy, Bill and Tim Kaine. 2025. “Our Bipartisan Plan Could Rescue Social Security.” (July 8). Washington, DC: The Washington Post.
Chen, Anqi, Alicia H. Munnell, and Jean-Pierre Aubry. 2026. “Can Equity Investments Help Social Security’s Long-run Financing?” Special Report. Chestnut Hill, MA: Center for Retirement Research at Boston College.
Damodaran, Aswath. 2025. Historical Returns on Stocks, Bonds, and Bills – United States. New York, NY: NYU Stern School of Business.
Kumar, Manmohan S. and Jaejoon Woo. 2010. “Public Debt and Growth.” Working Paper 10/174. Washington, DC: International Monetary Fund.
Marshall, David and Genevieve Pham-Kanter. 1999. “Investing Social Security Trust Funds in the Stock Market.” Chicago Fed Letter No. 148. Chicago, IL: Federal Reserve Bank of Chicago.
Munnell, Alicia H. and Michael Wicklein. 2023. “Should Social Security Invest in Equities?” Issue in Brief 23-14. Chestnut Hill, MA: Center for Retirement Research at Boston College.
Nelson, Jaeger. 2025. “Effects of Federal Borrowing on Interest Rates and Treasury Markets.” Hoover Institution’s Fiscal Policy Initiative: The Economic Consequences of U.S. Fiscal Policy Trends. Washington DC: Congressional Budget Office.
Plante, Michael, Alexander W. Richter, and Sarah Zubairy. 2025. “Revisiting the Interest Rate Effects of Federal Debt.” Research Department Working Papers No. 2513. Dallas, TX: Federal Reserve Bank of Texas.
Polzer, Karl. 2025. “Investing Social Security funds in the Stock Market Is Way Too Risky.” Opinion. Washington, DC: The Hill.
Reischauer, Robert D. 1999. “Investing Social Security Reserves In Private Securities.” Commentary. Washington, DC: The Brookings Institution.
Social Security Advisory Council. 1994-1996. Advisory Council on Social Security Technical Panel on Trends and Issues in Retirement Savings Final Report. Washington, DC.
Topiwala, Pankaj. 2023. “Towards Long-Term Solvency of US Entitlement Trust Funds, I: How to Market Time Trillions.” The Journal of Retirement 11(4): 61-86.
U.S. Railroad Retirement Investment Trust. 2026. “National Railroad Retirement Investment Trust Questions and Answers.” Chicago, IL.
U.S. Social Security Administration. 2025. The 2025 Annual Report of the Board of Trustees of the Federal Old-Age and Survivors Insurance and Federal Disability Insurance Trust Funds. Washington, DC.
U.S. Department of Treasury. 2026. “Debt to the Penny.” Washington, DC.
Vanguard. 2026. “2026 Outlook: Economic Upside, Stock Market Downside.” Article. Malvern, PA.
Wilshire Associates. 2026. “FT Wilshire 5000 Index Series.” Santa Monica, CA.
Zhe, Li. 2022. “Railroad Retirement Board: Trust Fund Investment Practices.” Report No. CRS RS22782. Washington, DC: Congressional Research Service.
Endnotes
- Chen, Munnell, and Aubry (2026). ↩︎
- President Clinton later proposed that a modest portion of reserves could be invested in equities, but Congress did not act on this proposal. To this day, the trust fund is invested exclusively in special-issue Treasury securities. ↩︎
- A trust fund ratio of 1.0, which means that the fund’s reserves can cover a year of anticipated outlays, is the benchmark used by the Social Security Trustees to determine whether the fund meets the short-term test of financial adequacy. See Chen, Munnell, and Aubry (2026) for more detailed methodology; this approach was based on an earlier study (Burtless et al. 2016). ↩︎
- Beyond higher returns, economists have argued that introducing equities would improve the allocation of risk over the lifespan. Theory holds that efficient risk sharing across the lifecycle requires individuals to bear more financial risk when young and less when older. But younger workers typically hold limited risky, high-yielding financial assets because they have not yet accumulated much wealth. The one important asset that they do hold is a growing claim on future Social Security benefits. However, under the current trust fund investment policy, this asset is invested solely in safe, low-expected-return Treasury bonds. Shifting Social Security asset holdings from low-risk, low-return bonds to higher-risk, high-expected-return equities would shift some financial market risk from the old to the young, thereby improving the age distribution of risk. ↩︎
- Similar concerns were raised during the Clinton Administration’s desired reforms (see Reischauer 1999 or Marshall and Pham-Kanter 1999). For more recent discussion, see, for example, Topiwala (2023), Munnell and Wicklein (2023), and Polzer (2025). ↩︎
- The level of where government ownership in the stock market becomes concerning is debated. While most agree that government ownership of over 50 percent will influence corporate governance, some argue that owning even 10-20 percent may influence corporate decision-making. However, as discussed above, there are ways to limit the role of government stock ownership such as outsourcing or not voting on their shares. Additionally, the concern of government interference in capital markets is also limited in countries with strong corruption control and minority shareholder protections. ↩︎
- For details, see Cassidy and Kaine (2025). ↩︎
- See 2025 Social Security Trustees Report, Tables IV.B3, VI.A1, VI.A3, and VI.G6. ↩︎
- For details, see Chen, Munnell, and Aubry (2026). ↩︎
- A Monte-Carlo analysis with 10,000 simulations is used in order to project the range of outcomes for both Cassidy-Kaine and traditional equity investment proposals. Data for equity returns are based on the Wilshire 5000. See Chen, Munnell, and Aubry (2026) for a more detailed methodology. ↩︎
- This return assumption is likely based on the National Railroad Retirement Investment Trust returns from 2003-2021. See Zhe (2022). ↩︎
- Of the 6.5 percent real return, about 2 percent is from dividends, leaving the remaining 4.5 percent growth stemming from capital appreciation. ↩︎
- The Gordon growth model, which establishes a steady state relationship between market value, stock returns, and GDP, suggests that stock returns equal the adjusted dividend yield plus the growth rate of dividends. In a steady state, the dividend growth is equal to the growth rate of GDP and a dividend yield of 1.5-2.0 is often used to value U.S stocks. The long-run stock return implied by the Gordon equation is 3.5-4.0. The analysis uses 4.0 to be optimistic, in line with the predictions of many practitioners. ↩︎
- Specifically, a 1-percentage-point-increase in the debt-to-GDP ratio will increase interest rates by about 2.5 basis points (see Nelson 2025 and Plante, Richter, and Zubairy 2025). Kumar and Woo (2010) found a 10-percentage-point-increase in GDP would reduce GDP growth by 20 basis points. ↩︎
- The total amount of borrowing proposed by Cassidy-Kaine would increase the debt-to-GDP ratio by over 75 percentage points over 75 years, suggesting interest rates will be roughly 1.9 percentage points higher and equity returns will be roughly 0.5 percentage points lower after all the borrowing. The impact, however, could be considerably less, given that the actual increase in debt would rise gradually over 75 years as the Treasury covers the gap between scheduled benefits and annual revenues. Additionally, extrapolations from existing models suggest that the equity risk premium would be negative. To be optimistic, the analysis assumes a floor for the equity risk premium of around 1.0. ↩︎
- These results are similar to Biggs (2026). ↩︎
- We assume, following the “Maintenance-of-Benefits” proposal outlined in the 1994-1996 Social Security Advisory Council report, that starting in the year of implementation of this proposal, the percentage of trust fund reserves invested in equities would increase by 2.67 percentage points each year up to a ceiling equity allocation of 40 percent. See Chen, Munnell, and Aubry (2026) for more details of the trust fund accounting. ↩︎
- Under consistent 6.5 percent real returns and current cost assumptions, Social Security would be able to pay promised benefits without further tax increases or benefits cuts if the trust fund ratio remained above roughly 2.2. With the lower 4.0 percent real return assumption, the trust fund ratio would need to be 3.5. ↩︎
- Since costs are increasing over the 75-year period, a one-time tax increase that closes the 75-year gap will produce small surpluses in early years that can be invested. ↩︎


Chen, Anqi, Alicia H. Munnell, and Jean-Pierre Aubry. 2026. "Can Equity Investments Help Social Security’s Finances?" Issue in Brief 26-10. Chestnut Hill, MA: Center for Retirement Research at Boston College.