
How Do Public Pension Plan Returns Compare to Simple Index Investing?

The brief’s key findings are:
- Public pension plans are increasingly relying on alternative investments and active management.
- But how does plan performance compare to a simple 60/40 index over various periods from 2000-2023?
- Over the full period, plan returns are virtually identical to the simple index strategy, but plans have done much worse since the Global Financial Crisis.
- If the current approach doesn’t yield higher long-term returns, a strong argument can be made for sticking with a simple, transparent strategy.
Introduction
Public pension plans have been shifting toward more complex investments in the past two decades, moving a sizable share of assets out of traditional equities, bonds, and cash into alternative assets, and expanding their reliance on external managers. This increased complexity, coupled with a shift toward active management, contrasts sharply with other investors, who have moved toward simpler, passive strategies, triggering a debate about whether the more complex active approach produces higher returns.
Some recent studies argue that pension plans could have done better investing solely in simple index funds. Critics counter that this assertion depends heavily on the time period analyzed. For example, studies that focus on the past decade – when strong and consistent stock market growth favored index funds over active management – may overstate the advantages of passive investing. Further complicating the discussion is pension funds’ use of lagged returns for some alternative assets, which can distort their overall reported return. To shed light on this debate, this brief investigates how the performance of public pensions compares to a simple passive indexing approach over various time periods, using pension returns adjusted for lagged reporting.
The discussion proceeds as follows. The first section briefly discusses public plan investment practices, with a focus on the growing use of complex active management. The second section reports on existing studies comparing public plan returns with indexed investing. To address some of the limitations of prior studies, the third section compares the returns of public plans to a simple 60/40 index over various periods since 2000. The final section concludes that, overall, pension funds have performed similarly to the simple passive strategy since 2000, but have lagged behind it since the Global Financial Crisis. If public plans cannot reasonably anticipate higher long-term returns from a complex active approach, a strong argument could be made that they should stick with a simple and transparent strategy.
Public Pension Investment Practices
The investment activities of public pension funds occur at two levels: the overall allocation to broad asset classes and the specific investments within each asset class – both of which typically involve elements of active management.
Regarding broad asset allocation, a public plan generally sets a target through its board of directors, based on inputs from outside consultants as well as the plan’s own investment staff. As the plan portfolio diverges from the target due to market movements, the fund moves money across asset classes to get back to the target, which aligns with a “stay-the-course” passive rebalancing approach.1Although a range around the target allocation is typically allowed, Aubry and Wandrei (2019) found that public plans, on average, follow their target allocations in a relatively strict manner. But, pension funds also regularly adjust their targets based on their evolving beliefs about capital markets and diversification, which reflects a more active investing style.
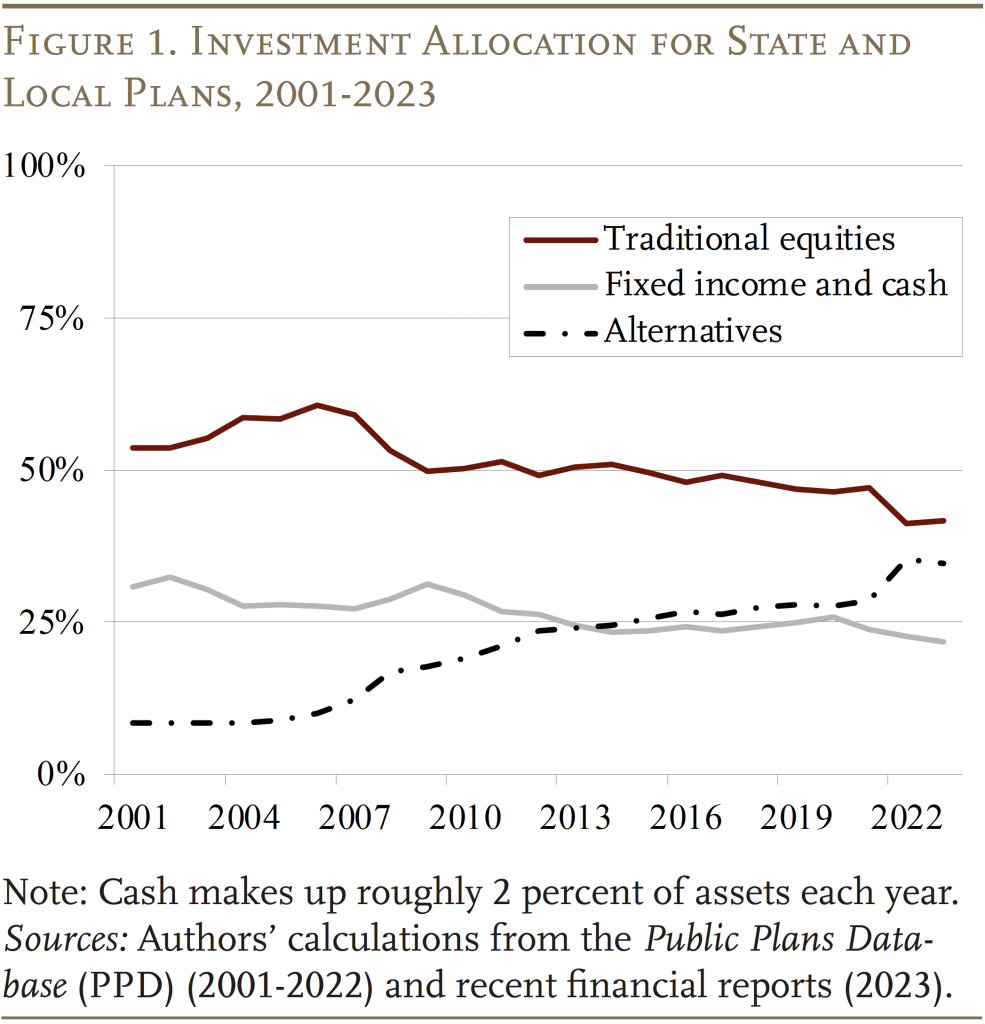
In recent years, pension plans have been shifting their targets from traditional equities and bonds to alternative assets, such as private equities, hedge funds, real estate, and commodities. While their financial reports often cite diversification and risk reduction as the reasons for this shift, prior studies suggest that reaching for higher returns is the main motivation.2For more details on the rationale for shifting to alternatives, see Aubry (2022). Importantly, public plans use their assumed investment return – 7 percent, on average, in 2023 – to value liabilities and calculate required contributions. Research has shown that this practice encourages plans to maintain high assumed returns and seek these returns through riskier asset allocations. See Andonov, Bauer, and Cremers (2016) and Aubry and Crawford (2019). At the same time, sharp declines in the value of traditional stocks and bonds – as in 2008, 2009, and 2022 – have also contributed to the growing share of pension fund assets held in alternatives (see Figure 1).
In addition to actively changing their high-level asset allocation, most plans hire external managers to actively manage investments within each asset class.3See Aubry and Wandrei (2020) for a more detailed discussion on internal and external management for public pension plans. Investments in alternatives are – almost by definition – actively managed by outside investors. But, many pension funds also use external managers to actively manage investments in more traditional asset classes.4Some plans – mostly large – internally manage a meaningful portion of their holdings in traditional asset classes like public equities and fixed income because they can be managed passively. However, more recently, some plans have started to shift more of their equity holdings to externally managed active funds with the belief that the pandemic and geopolitical events have resulted in an investment environment that favors active management. See Ligon and Appell (2024) and Hildebrand et al. (2023). The question is whether all this shuffling of investments and greater reliance on complex assets – which comes with higher fees and more staff – is better than sticking with index funds of traditional stocks and bonds.
Findings from Prior Research
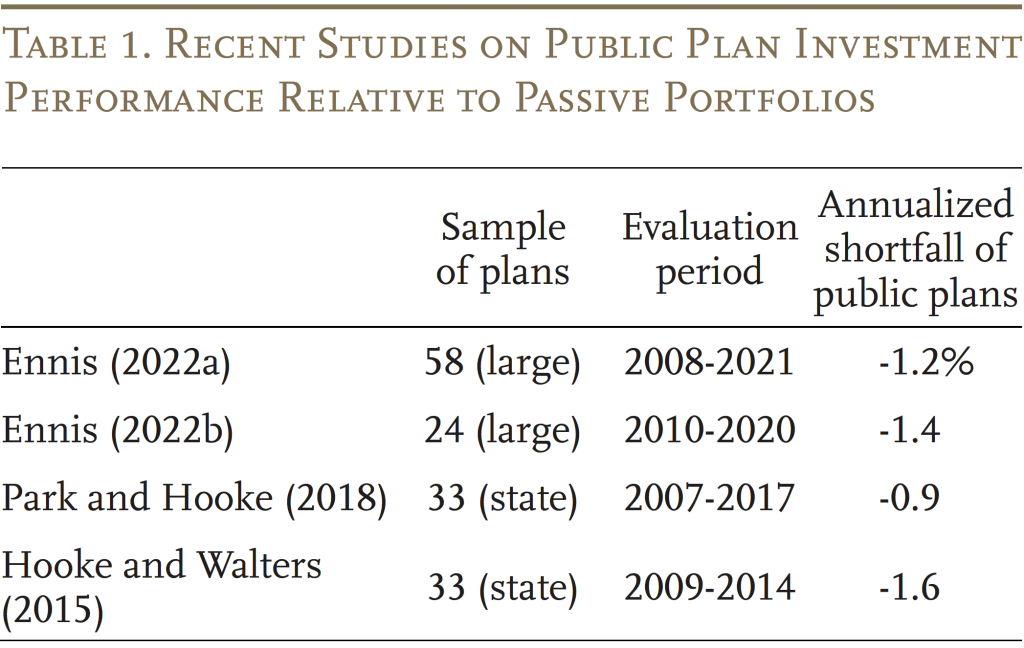
Some recent studies have argued that public pensions could get higher after-fee returns by investing only in passive index funds (see Table 1). Generally, these analyses compare a simple index portfolio (e.g., traditional stocks and bonds that reflect the overall risk profile of public plans) to that of a sample of large public plans over a 5- to 10-year period starting after 2007.5The methodologies for constructing the index portfolio vary across these studies. Ennis (2022a, 2022b) constructs the index portfolio using “return-based style analysis” pioneered by William Sharpe, which employs statistical methods to identify the combination of simple indexes, typically those for stocks and bonds, that best mimic the movement of a more complex portfolio’s past returns. Park and Hooke (2018) use the well-known 60/40 portfolio of stocks and bonds. Hooke and Walters (2015) include private equity and real estate in addition to stocks and bonds to mimic the actual asset allocations of public plans more closely. Their results consistently show that public plans in aggregate underperform index portfolios by 0.9 percent to 1.6 percent annualized.
Importantly, some dismiss these findings as being dependent on the period examined. Indeed, a significant limitation is that they focus on the years after the Global Financial Crisis, during which simple passive investing has trumped complex active investing. In addition, the studies do not include the 2022 downturn – when many plans reported much higher returns than simple indexed portfolios. Although, these higher returns could potentially be related to how pension funds report their returns, which raises another issue with existing studies – that most rely on data that use lagged returns for private assets.6For example, see Mitchell (2023).
Assessing Pension Fund Performance Since 2000
The following analysis helps clarify the current debate in two ways. First, to accurately assess fund performance, we correct for the inclusion of lagged returns for private assets (see Appendix A). Second, to present a more complete picture of pension plan performance, we assess the corrected returns over various periods between June 2000 and June 2023 – the full period of the readily available data. We compare pension fund returns to a hypothetical simple index portfolio of 60 percent US stocks (Russell 3000 Total Return Index) and 40 percent US bonds (Bloomberg US Aggregate Bond Index), with a 10-basis point management fee.7The weighted average costs of index funds declined from about 20 basis points in early 2000s to 5 basis points in 2022 (Investment Company Institute, 2022). Ennis (2022a, 2022b) find that an index portfolio consisting of approximately 70-percent stocks and 30-percent bonds can best mimic, in a statistical sense, the pattern of historical aggregate returns of public plans. Using a 70/30 index portfolio does not change the overall results of the analysis in this brief.
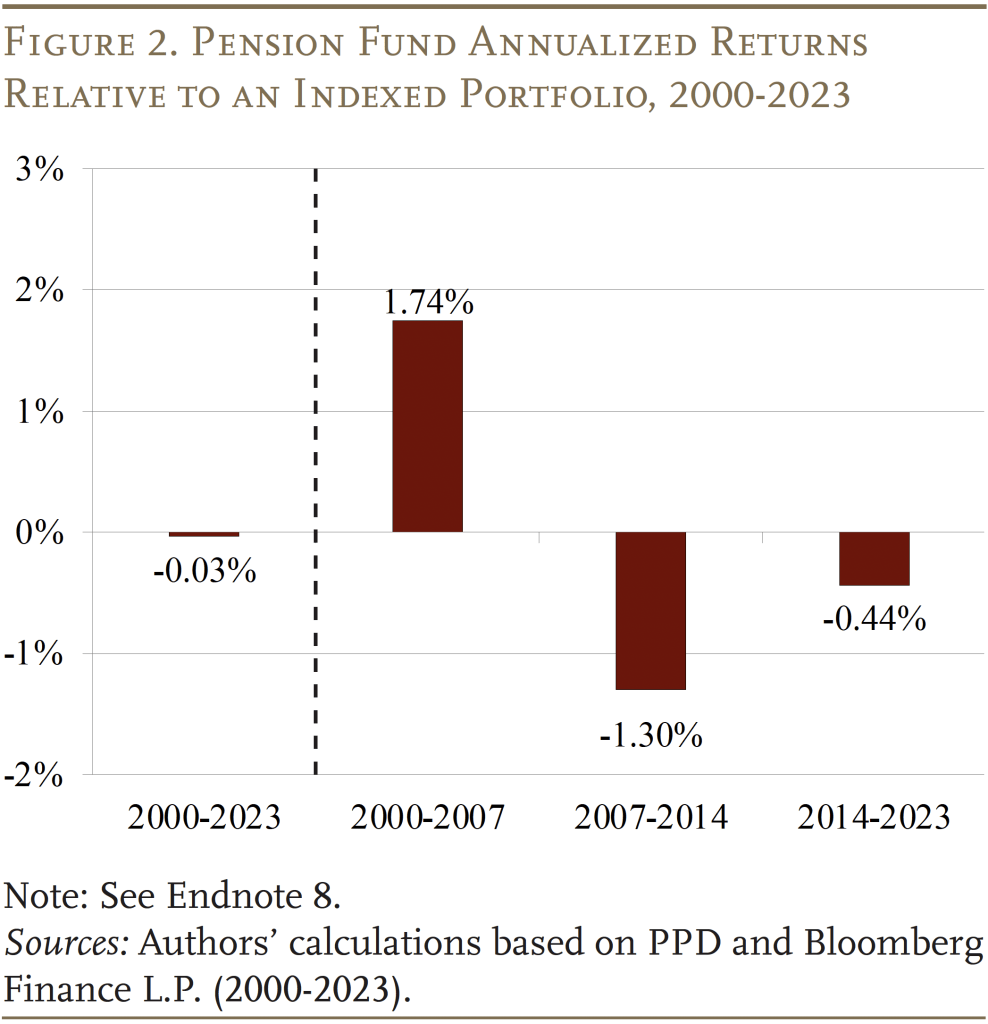
To begin, Figure 2 shows pension plan performance over the long-term (June 2000 to June 2023) and three sub-periods: pre-crisis (June 2000 to June 2007), early post-crisis (June 2007 to June 2014) and later post-crisis (June 2014 to June 2023).8Public plan performance is based on the aggregate (i.e., asset-weighted) annual net-of-fee returns for PPD plans with fiscal year ending June 30th. Indexed portfolios are assumed to have an annual 10-basis point management fee and returns based on the performance of the following indices: Russell 3000 Total Return Index for US stocks and Bloomberg US Aggregate Bond Index for US bonds. The metric shown is the difference between the annualized return for public plans and the indexed portfolios – positive values indicate higher returns by public plans. The key takeaway is that the long-term annualized return for pension funds is almost the same as that of the 60/40 portfolio (about 6.1 percent for both).9For simplicity, public plan performance is based on the aggregate (i.e., asset-weighted) annual returns for PPD plans with fiscal year ending June 30th (145 plans that account for about three-quarters of the total asset value of plans in the PPD). On average, pension funds report investment fees of about 50 basis points and most plans report pension fund returns net of fees. However, the results also reveal an interesting two-part story underlying this similar performance – pension funds did much better than the index funds pre-crisis and much worse post-crisis.10Focusing on the ratio of the return to the standard deviation – a simplified risk-return ratio – shows that the 60/40 portfolio outperformed pension funds pre-crisis and post-crisis.
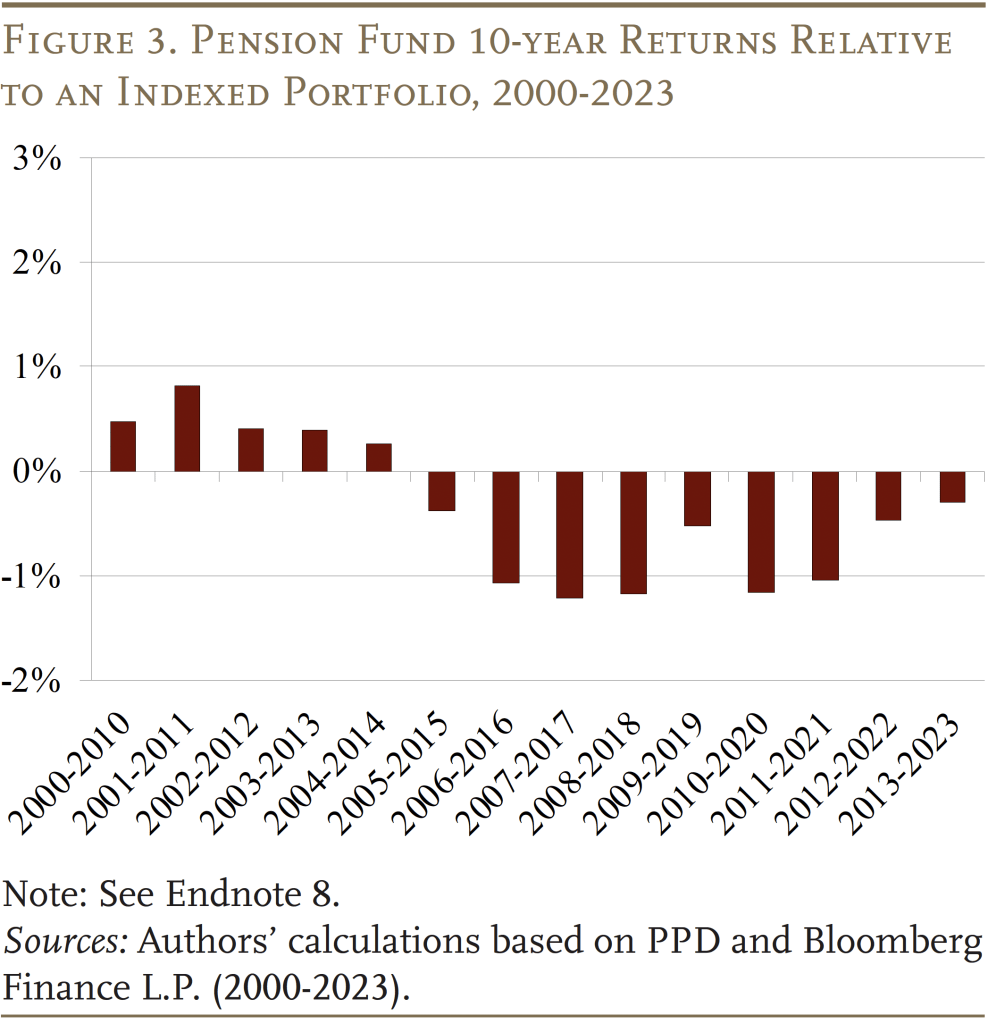
Next, we compare performance over each 10-year period between 2000 to 2023 (see Figure 3). Pension funds underperform in over half of the 10-year periods, and the two-part story emerges again with plans consistently doing better through 2014 and falling short afterward.
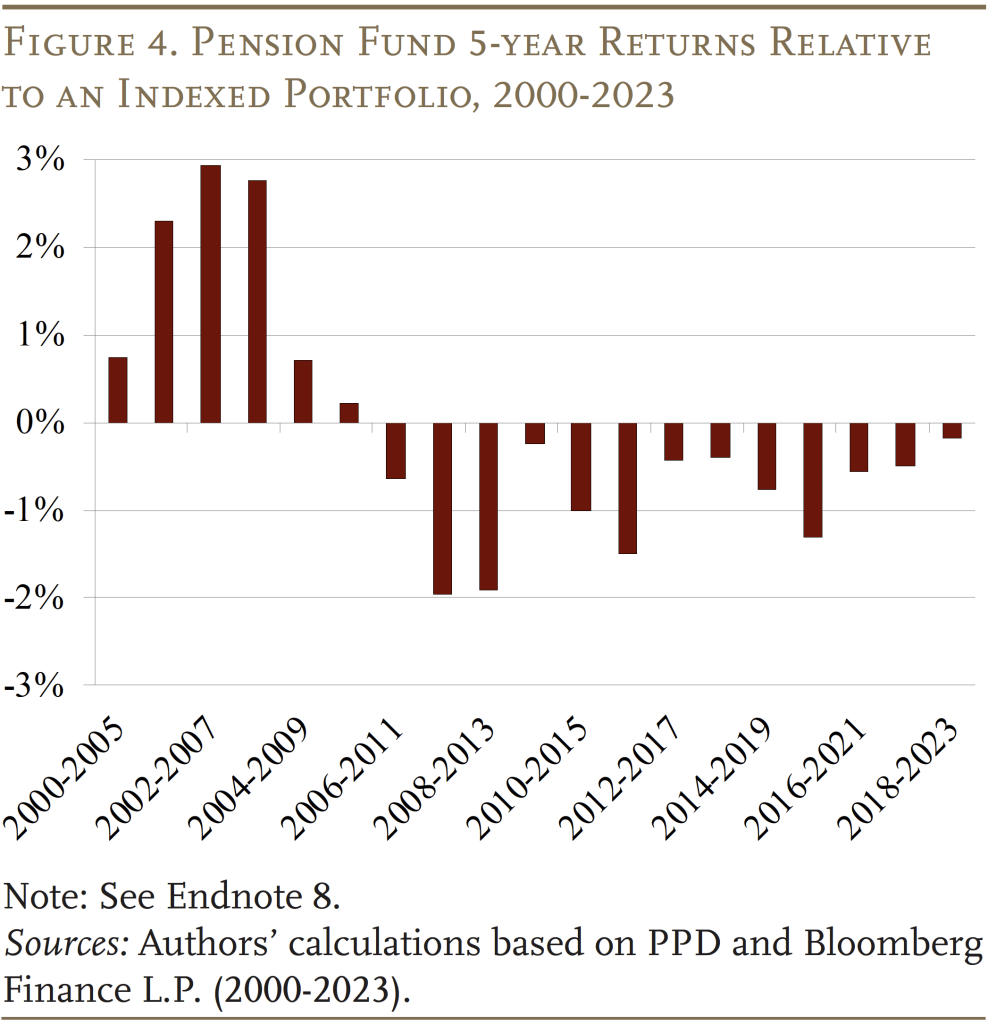
Finally, Figure 4 presents the results for each 5-year period between 2000 and 2023. Again, the overall results are similar. Pension funds underperform in two-thirds of the periods – doing better through 2010 before falling short each year afterward. (See Appendix B for more details on how trends in asset allocation affect the results).
Importantly, these results likely overstate the performance of pension funds due to costs associated with complex active investment approaches, such as salaries for a larger in-house investment staff, and certain unreported fees for alternative investments.11Like public pension funds in the United States, the Canada Pension Plan started moving more toward active management in 2006, which increased its staff from about 100 to over 2,000. During this period, its performance fell slightly short of its target index portfolio over the period (CPP 2024).
Conclusion
The overall shift toward more complex actively managed assets has raised concerns over pension fund investment practices. While recent studies have argued that plans could have done better relying only on simple index funds, the studies have been critiqued as being too dependent on the period examined and using lagged reported returns.
This brief investigates public plan performance over various periods since 2000 using returns adjusted for lagged reporting. While pension funds outperformed the simple portfolio prior to the Global Financial Crisis, they fell short thereafter. As a result, pension funds’ annualized aggregate returns since 2000 have been virtually identical to a simple 60-40 index portfolio.
If public plans cannot reasonably anticipate higher long-term returns from a complex active approach, they should stick with a simple and transparent strategy.
References
Andonov, Aleksandar, Rob M. M. J. Bauer, and K. J. Martijn Cremers. 2017. “Pension Fund Asset Allocation and Liability Discount Rates.” The Review of Financial Studies 30(8): 2555-2595.
Aubry, Jean-Pierre. 2022. “Public Pension Investment Update: Have Alternatives Helped or Hurt?” Issue in Brief 22-20. Chestnut Hill, MA: Center for Retirement Research at Boston College.
Aubry, Jean-Pierre and Caroline V. Crawford. 2019. “Impact of Public Sector Assumed Returns on Investment Choices.” State and Local Plans Issue in Brief 63. Chestnut Hill, MA: Center for Retirement Research at Boston College.
Aubry, Jean-Pierre and Kevin Wandrei. 2019. “Maintaining Target Allocations: Effects on Plan Performance.” State and Local Plans Issue in Brief 64. Chestnut Hill, MA: Center for Retirement Research at Boston College.
Aubry, Jean-Pierre and Kevin Wandrei. 2020. “Internal vs. External Management for State and Local Pension Plans.” State and Local Plans Issue in Brief 75. Chestnut Hill, MA: Center for Retirement Research at Boston College.
Beath, Alexander and Chris Flynn. 2023. “Asset Allocation and Fund Performance of Defined Benefit Pension Funds in The United States Between 1998-2021.” Toronto, ON: CEM Benchmarking.
Bloomberg Finance L.P. Bloomberg Terminal, 2000-2023. New York, NY.
CPP Investments. 2024. Annual Report. Toronto, Ontario.
Ennis, Richard. 2022a. “Pulling Back the Curtain on Public Pension Fund Performance.” Working Paper.
Ennis, Richard M. 2022b. “Cost, Performance, and Benchmark Bias of Public Pension Funds in the United States: An Unflattering Portrait.” The Journal of Portfolio Management 48(5): 138-150.
Florida State Board of Administration. 2022. “Investment Performance Reports.” Tallahassee, FL.
Hildebrand, Philipp, Jean Boivin, Wei Li, Alex Brazier, Christopher Kaminker, and Vivek Paul. 2023. “2024 Investment Outlook, Grabbing the Wheel: Putting Money to Work.” New York, NY: BlackRock Investment Institute.
Hooke, Jeff C. and John Walters. 2015. “Wall Street Fees and Investment Returns for 33 State Pension Funds.” Maryland Policy Report No. 2015-05. Rockville, MD: The Maryland Public Policy Institute.
Investment Company Institute. 2022. “Trends in the Expenses and Fees of Funds.” ICI Research Perspective 29(3). Washington, DC.
Ligon, Cheyenne and Douglas Appell. 2024. “For Some Pension Funds, Active Investing Is Once Again Attractive.” (February 7). New York, NY: Pensions & Investments.
Mitchell, Justin. 2023. “‘Where Is the Money?’: Ohio Teachers’ Pension Board Member Confronts Callan CEO.” (March 23). New York, NY: FundFire.
Park, Carol and Jeff Hooke. 2018. “2018 State Pension Fund Investment Performance Report.” Maryland Policy Report No. 2018-02. Rockville, MD: The Maryland Public Policy Institute.
Public Plans Database. 2001-2023. Center for Retirement Research at Boston College, MissionSquare Research Institute, National Association of State Retirement Administrators, and the Government Finance Officers Association.
Appendix A: Correcting Returns for Lagged Reporting
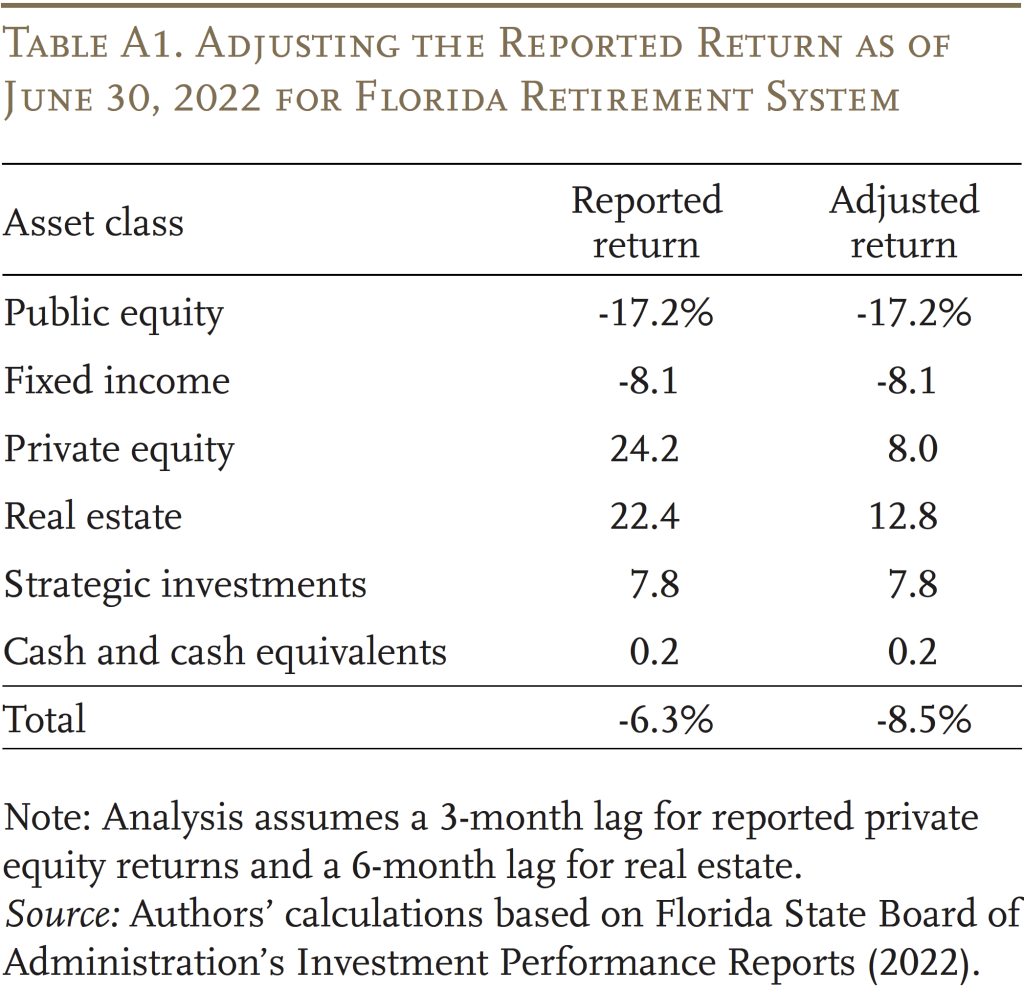
The broad shift away from traditional stocks and bonds makes the assessment of public pension fund investment performance more challenging in two ways. First, an increasing share of their investments are illiquid and valued based on expert appraisals. Second, reported pension fund returns often include lagged data on the performance of their private assets. While we cannot adjust for the subjective nature of certain asset valuations, we can adjust for the explicitly lagged data for private assets. For example, the Florida Retirement System reported a portfolio return of -6.3 percent as of June 30, 2022 (see Table A1). However, the return was calculated using lagged annual returns for its holdings of private equity and real estate. Updating the pension fund’s reported portfolio return to include the actual June 30 returns for private equity and real estate (in this case, taken from subsequent quarterly investment reports) reduces it to -8.5 percent.
For the analysis, we make a similar adjustment for the public plan universe in aggregate (rather than just an individual plan). First, we presume a 3-month lag in the reporting of private equity and an 8-month lag for real estate.12Beath and Flynn (2023). Second, we determine the relationship between the private asset return reported by pension funds (in aggregate) and the return on a related market index. Finally, we use this relationship to shift reported pension fund returns forward. For example, for pension funds that report June 30 annual returns, we compare their reported annual return for private equity (which is lagged) to the March 31 annual return for a private equity index. This provides the relationship between the performance of pension funds’ private equity and the performance of the index. Then, we apply that relationship to the index’s June 30 annual return to estimate the June 30 return for the private equity held by pension funds.
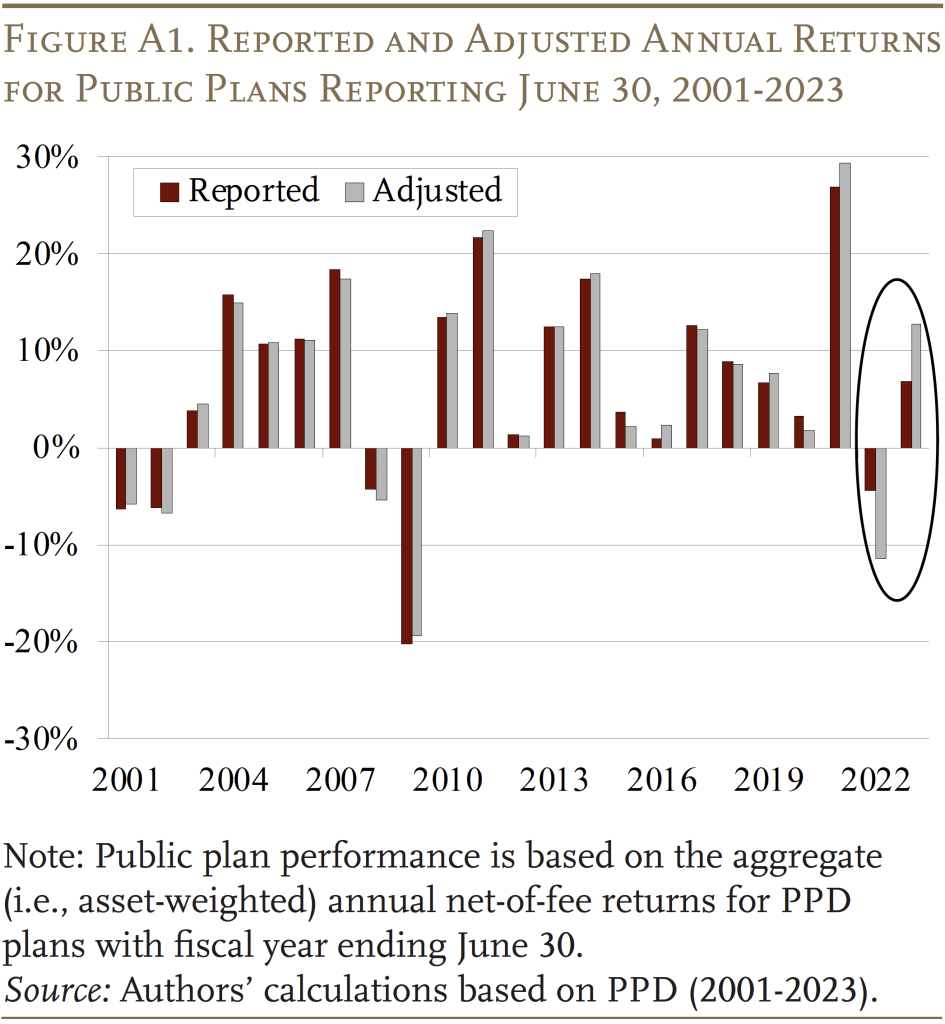
Figure A1 shows the reported and adjusted annual returns for the public plan universe in aggregate. Interestingly, the results show that the adjusted returns are quite similar to actual returns for all years except 2022 and 2023. The reason is twofold. First, the share of total assets invested in alternatives – specifically private equity and unlisted real estate – has steadily grown since 2000, making the potential impact of the lagged reporting more significant in the later years of our analysis period. But, the more important – and, somewhat idiosyncratic – reason is the precise timing and duration of market swings (i.e., the change over the lagged period must be meaningfully different than the change over the actual reporting period). For example, using the public equity markets as an indicator for asset valuations more generally, the return on the Russell 3000 from March 2021 to March 2022 was much higher than the return from June 2021 to June 2022. The returns for private equity and real estate followed a similar pattern, which, if left unadjusted, would overstate the overall performance of public plans for any period ending in 2022.
Appendix B: A Deeper Dive into the Results
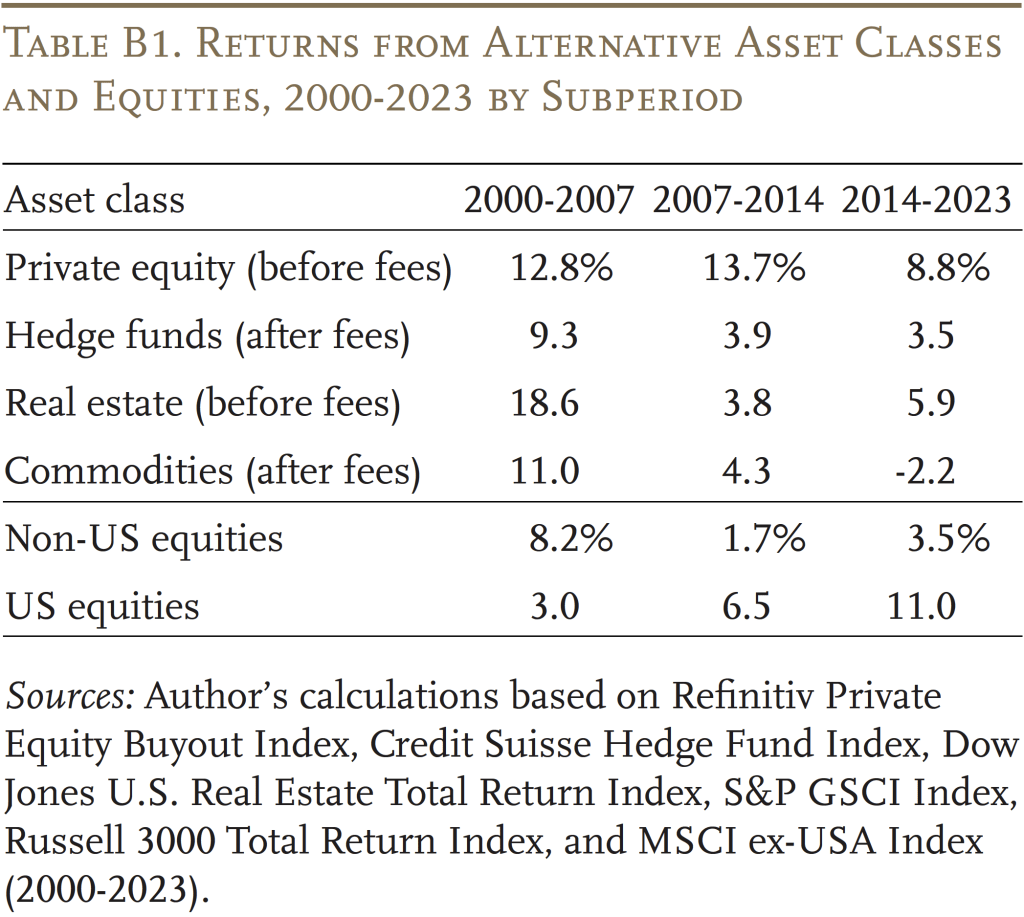
The main driver behind public plans’ performance relative to the index portfolio is how well the various risky asset classes do relative to domestic stocks. From 2000 to 2007, the performance for all types of risky assets – including private equity, real estate, hedge funds, commodities, and international stocks – substantially outpaced that of domestic equities (see Table B1). Even though these asset classes made up a smaller share of pension fund portfolios during that period, they helped boost performance relative to a simple 60/40 portfolio of domestic stocks and bonds. However, since 2007, most risky asset classes – especially hedge funds, commodities, and international stocks – have underperformed domestic stocks.13Aubry (2022) estimates that, on average for public plans in the PPD, a 10-percent increase in the allocation to hedge funds and commodities is associated with a decrease in after-fee returns of 67 and 60 basis points, respectively, during 2010-2022. Private equity and real estate, although continuing to earn robust returns after 2010 as in the early 2000s, provided no statistically significant improvement on public plans’ after-fee returns during 2010-2022, suggesting some plans could have done just as well by investing in traditional equities. Unfortunately, this weaker performance has occurred just as public pensions have been increasing their reliance on these asset classes, exacerbating their drag on the funds’ total returns.14According to the PPD, hedge funds and commodities combined to account for 32 percent of public plans’ aggregate alternative investments in 2023, increasing from 22 percent in 2001. Similarly, non-U.S. stocks have grown from roughly 20 percent of pension funds’ traditional equity holdings in 2000 to almost 40 percent in 2023. As an interesting aside, the poor performance of fixed income assets over the past few years due to rising interest rates has helped improve the relative performance of pension funds because they hold less in bonds than the simple 60/40 portfolio.
Also contributing to public plans’ relative performance is the way that plans shifted their allocation following major downturns in the equity markets. After the dot-com bust in 2002, plans moved more money back into stocks and out of bonds, with little activity in the other asset classes, to maintain a relatively consistent allocation to equities.15See Aubry and Wandrei (2019). Although this maneuver did not help public plans beat the index portfolio directly, the rebalancing back towards stocks was similar to the consistent equity allocation of the index portfolio and helped plans gain from the subsequent rebound in equity markets. In contrast, during the 2008-2009 financial crisis, pension funds moved money out of equities as part of their shift away from traditional stocks and bonds into alternatives. Relative to the consistent equity allocation of the index portfolio, the timing of the shift likely locked in some of the equity losses and excluded plans from the rebound of equity values in the post-crisis years.
Endnotes
- 1Although a range around the target allocation is typically allowed, Aubry and Wandrei (2019) found that public plans, on average, follow their target allocations in a relatively strict manner.
- 2For more details on the rationale for shifting to alternatives, see Aubry (2022). Importantly, public plans use their assumed investment return – 7 percent, on average, in 2023 – to value liabilities and calculate required contributions. Research has shown that this practice encourages plans to maintain high assumed returns and seek these returns through riskier asset allocations. See Andonov, Bauer, and Cremers (2016) and Aubry and Crawford (2019).
- 3See Aubry and Wandrei (2020) for a more detailed discussion on internal and external management for public pension plans.
- 4Some plans – mostly large – internally manage a meaningful portion of their holdings in traditional asset classes like public equities and fixed income because they can be managed passively. However, more recently, some plans have started to shift more of their equity holdings to externally managed active funds with the belief that the pandemic and geopolitical events have resulted in an investment environment that favors active management. See Ligon and Appell (2024) and Hildebrand et al. (2023).
- 5The methodologies for constructing the index portfolio vary across these studies. Ennis (2022a, 2022b) constructs the index portfolio using “return-based style analysis” pioneered by William Sharpe, which employs statistical methods to identify the combination of simple indexes, typically those for stocks and bonds, that best mimic the movement of a more complex portfolio’s past returns. Park and Hooke (2018) use the well-known 60/40 portfolio of stocks and bonds. Hooke and Walters (2015) include private equity and real estate in addition to stocks and bonds to mimic the actual asset allocations of public plans more closely.
- 6For example, see Mitchell (2023).
- 7The weighted average costs of index funds declined from about 20 basis points in early 2000s to 5 basis points in 2022 (Investment Company Institute, 2022). Ennis (2022a, 2022b) find that an index portfolio consisting of approximately 70-percent stocks and 30-percent bonds can best mimic, in a statistical sense, the pattern of historical aggregate returns of public plans. Using a 70/30 index portfolio does not change the overall results of the analysis in this brief.
- 8Public plan performance is based on the aggregate (i.e., asset-weighted) annual net-of-fee returns for PPD plans with fiscal year ending June 30th. Indexed portfolios are assumed to have an annual 10-basis point management fee and returns based on the performance of the following indices: Russell 3000 Total Return Index for US stocks and Bloomberg US Aggregate Bond Index for US bonds.
- 9For simplicity, public plan performance is based on the aggregate (i.e., asset-weighted) annual returns for PPD plans with fiscal year ending June 30th (145 plans that account for about three-quarters of the total asset value of plans in the PPD). On average, pension funds report investment fees of about 50 basis points and most plans report pension fund returns net of fees.
- 10Focusing on the ratio of the return to the standard deviation – a simplified risk-return ratio – shows that the 60/40 portfolio outperformed pension funds pre-crisis and post-crisis.
- 11Like public pension funds in the United States, the Canada Pension Plan started moving more toward active management in 2006, which increased its staff from about 100 to over 2,000. During this period, its performance fell slightly short of its target index portfolio over the period (CPP 2024).
- 12Beath and Flynn (2023).
- 13Aubry (2022) estimates that, on average for public plans in the PPD, a 10-percent increase in the allocation to hedge funds and commodities is associated with a decrease in after-fee returns of 67 and 60 basis points, respectively, during 2010-2022. Private equity and real estate, although continuing to earn robust returns after 2010 as in the early 2000s, provided no statistically significant improvement on public plans’ after-fee returns during 2010-2022, suggesting some plans could have done just as well by investing in traditional equities.
- 14According to the PPD, hedge funds and commodities combined to account for 32 percent of public plans’ aggregate alternative investments in 2023, increasing from 22 percent in 2001. Similarly, non-U.S. stocks have grown from roughly 20 percent of pension funds’ traditional equity holdings in 2000 to almost 40 percent in 2023. As an interesting aside, the poor performance of fixed income assets over the past few years due to rising interest rates has helped improve the relative performance of pension funds because they hold less in bonds than the simple 60/40 portfolio.
- 15See Aubry and Wandrei (2019).


Aubry, Jean-Pierre and Yimeng Yin. 2024. "How Do Public Pension Plan Returns Compare to Simple Index Investing?" Issue in Brief 24-13. Chestnut Hill, MA: Center for Retirement Research at Boston College.