
What Is the Insurance Value of Social Security by Race and Education?

The brief’s key findings are:
- The value of Social Security’s retirement program to individuals is often measured by comparing expected benefits to payroll taxes.
- But this approach ignores the program’s insurance value, which is larger for those with more uncertain lifespans.
- The analysis estimates the insurance value using a lifecycle model for stylized households by race, education, and marital status.
- Accounting for insurance value, the results show that the program is significantly more valuable than lifetime taxes for almost all household types.
- Social Security’s insurance component also increases racial equity, because lifespans vary more among Black individuals.
Introduction
Social Security helps Black individuals and those with low educational attainment – and therefore low earnings – through its progressive benefit structure. On the other hand, the nature of Old-Age and Survivors Insurance (OASI) as a life annuity inherently increases expected lifetime benefits for individuals who tend to live longer. Regardless of how these factors balance out, though, looking solely at expected benefits does not provide a full picture of Social Security’s value. Specifically, it neglects the program’s longevity insurance value, which favors Black beneficiaries and those with less education because they typically face greater uncertainty over how long they will live.
This brief, based on a recent paper, assesses the value of OASI, including the program’s longevity insurance value, by race, gender, marital status, and education; and it estimates the extent to which incorporating longevity insurance enhances the equalizing effect of OASI.1Arapakis, Wettstein, and Yin (2023).
The discussion proceeds as follows. The first section explains why OASI’s value might differ by race and socioeconomic status (SES). The second section describes the data and methodology. The third section presents the results. The final section concludes that once the insurance value of OASI is considered, the program is significantly more valuable than the lifetime OASI payroll taxes paid for almost all household types; and OASI increases racial equity in retirement security more than is suggested by measures of expected benefits alone.
Background
OASI benefits are commonly evaluated in terms of money’s worth: the present value of expected benefits relative to contributions. The progressive benefit formula provides greater rates of return on contributions for groups with lower lifetime earnings, while the longer life expectancies of higher earners mean that they will receive benefits for a longer period of time.2Sanzenbacher and Ramos-Mercado (2016) and Clingman, Burkhalter, and Chaplain (2022).
The money’s worth approach, however, neglects the longevity insurance provided by the program. OASI is a life annuity, so it offers households protection against outliving their resources, and the value of this protection increases with the unpredictability of their lifespan. It turns out that OASI longevity insurance is particularly important for Black households and those with low education, because, while these groups have lower average lifespans than others, they face greater uncertainty around their averages.3Sasson (2016) and Wettstein et al. (2021). The following analysis uses a structural model to examine both OASI’s insurance value and its money’s worth by race and SES.4Our methodology is similar to Wettstein et al. (2021), which simultaneously examined the insurance value and the money’s worth of different types of annuities by race and SES.
Data and Methodology
The analysis considers stylized households, differentiated by race (Black or White), SES (low- or high-education),5Education is defined in relative terms. That is, the classification of individuals to low and high education is done in relation to the median education for that individual’s race-gender-cohort. This approach is similar to Leive and Ruhm (2021) and Wettstein et al. (2021); it accounts for possible selection on unobservable characteristics into higher education across race, gender, and cohort. and household composition (single man, single woman, or married couple).6Married couples are assumed to be heterosexual and have the same race and education for both members. This process results in 12 stylized households (8 singles by gender, education, and race; and 4 couples by education and race) that differ in terms of their mortality probabilities, lifetime earnings, pension income, Social Security benefits, and wealth at age 65.
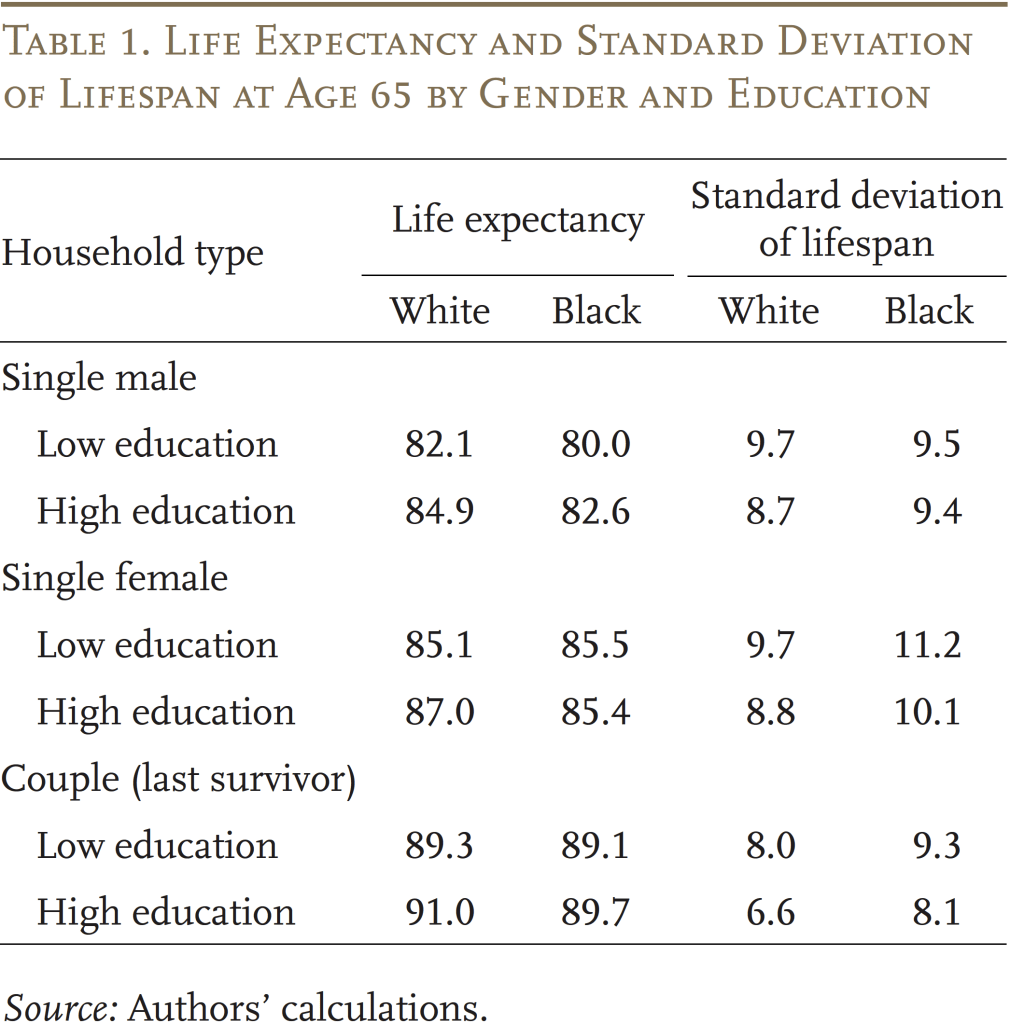
The data used to construct the stylized households’ OASI benefits, payroll tax contributions, and financial characteristics are from the Health and Retirement Study linked to administrative earnings records. The calculation of mortality rates by race and SES is based on mortality data from the National Vital Statistics System and demographic and SES information from the American Community Survey.7The calculation follows a two-step approach, as in Wettstein et al. (2021). Table 1 shows that Black households at age 65 generally have a shorter life expectancy than White ones, while they also face greater variance around their average lifespans.
The calculation of the money’s worth of OASI is straightforward: the expected present value of each household’s benefits is related to the lifetime contributions of the household to the OASI program.8These benefits include the payments from Social Security to workers, and, in households married at age 65, the benefits also include spousal benefits due, if any, to the lower-earning spouse, and survivor benefits to surviving spouses after widowhood. In this calculation, future benefits are discounted at a 2-percent rate and by the expected mortality probabilities for each household’s demographic characteristics. This calculation results in a measure of the expected return on each dollar of contributions from a purely financial perspective, neglecting any insurance value.
Next, to measure Social Security’s longevity insurance, the analysis estimates OASI’s “wealth equivalence.” This measure reflects how much more wealth households would need to be as well off in a world with no OASI program as they are with the program. Because households pay into the program during their working years, this wealth equivalence is also related to lifetime contributions, yielding a ratio of wealth-to-contributions (W-to-C). This ratio indicates how much value, measured in dollars, households derive from every dollar they contribute to OASI.
Calculating wealth equivalence requires a lifecycle model. In the model, households choose their consumption optimally to maximize their expected lifetime utility, considering their available resources and their survival uncertainty.9Households in the model are allowed to save, but not borrow. The wealth equivalence of OASI for each stylized household is estimated in two steps. First, the expected lifetime utility at age 65 for the household is calculated with OASI benefits; second, the calculation is repeated in a world without OASI benefits to find the amount of additional wealth at age 65 the household would need to be just compensated for not having the OASI benefit.
Both the W-to-C ratio and the money’s worth calculation measure the lifetime value of OASI benefits relative to the corresponding tax payments. However, only the former accounts for the longevity insurance value of OASI and is, therefore, expected to be greater than the latter. Thus, comparing these two measures sheds light on the extent to which neglecting longevity insurance underestimates the value of OASI to various types of households.
Results
Table 2 shows the money’s worth and the W-to-C ratio of OASI for the stylized households. As the OASI program is intended to be actuarially balanced for the general population, the money’s worth ratios for the stylized households vary around 1. Money’s worth also tends to be higher for women than men, reflecting both their lower earnings (which increases the return on contributions due to the progressivity of benefits) and their longer life expectancy, which means they will receive benefits for more years. In contrast, the patterns by race and education are more mixed: on the one hand, Black and lower-education households benefit from progressivity due to their lower earnings. On the other hand, these households also have lower life expectancies, offsetting the progressivity to some extent.
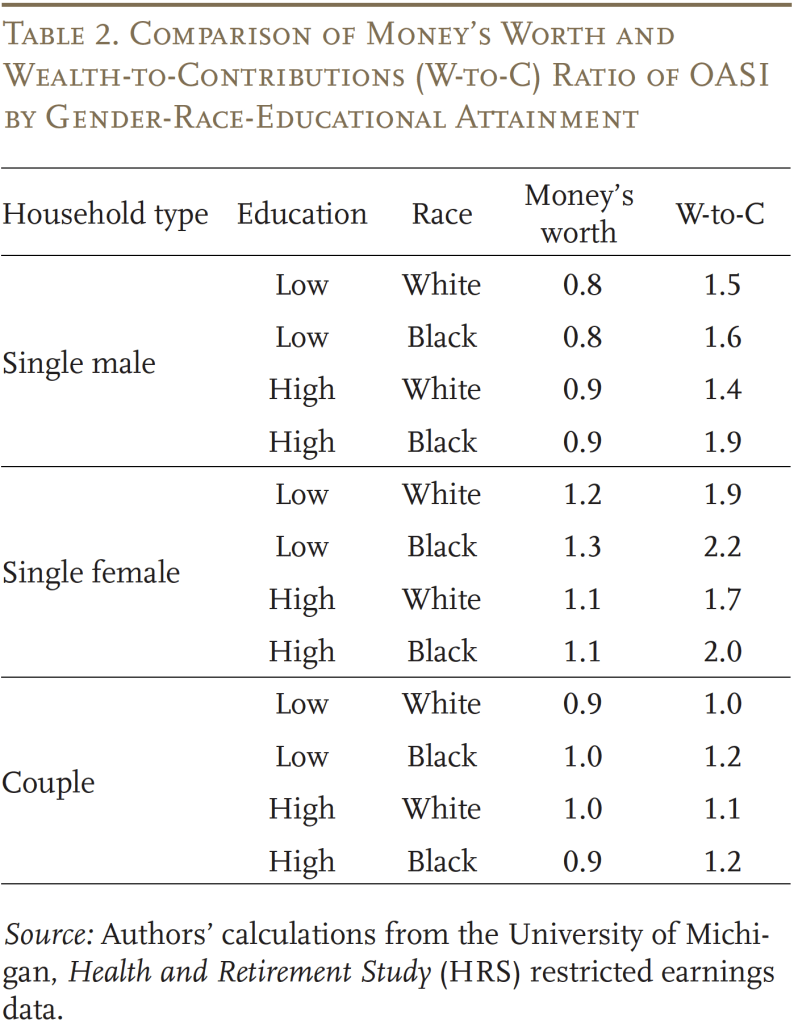
In contrast to money’s worth, the W-to-C ratio is strictly larger than 1 for almost all households. The fact that W-to-C is greater than 1 implies that most households, regardless of race, gender, education, or household composition, prefer a world in which OASI exists to one in which it does not. Moreover, on the margin, almost all households should be willing to pay a little more into the system if necessary to preserve its benefit levels.10Several caveats, however, pertain to this result. First, the model here assumes no bequest motives, no general equilibrium effects, and no late-life liquidity shocks (such as medical or long-term care expenses), all of which would reduce the value of OASI. Second, the model assumes no rate-of-return or inflation risks; which tends to understate the value of OASI benefits since they are insulated from financial markets and are indexed for inflation. Finally, the model assumes no income or capital gains taxes. The impact of this assumption could go either way. Furthermore, as expected, the W-to-C ratios are greater than money’s worth for all household types, implying households value longevity insurance.
The difference between the W-to-C ratio and the money’s worth ratio serves as an approximate measure of the longevity insurance value of OASI.11Taking the difference of these two measures captures the impact on the value of OASI of only the factors involved in the calculation of the W-to-C ratio but not in money’s worth, which include the variance of lifespan, initial wealth, and annuitized retirement income. We find that initial wealth and annuitized retirement income have very limited impact on the value of W-to-C ratios for all stylized households; thus, the difference between the W-to-C ratio and the money’s worth captures the variance of lifespan, which can be considered an approximate measure of OASI’s longevity insurance value. This value is especially large for singles (for all singles combined, it is worth about 80 percent of total payroll tax paid on average; see Figure 1). In contrast, couples have considerably lower W-to-C ratios which imply moderate longevity insurance values (worth 10 to 20 percent of total payroll tax paid). This result reflects the fact that a substantial portion of the longevity risk can be self-insured between family members who permit other family members to receive their wealth after death.12This pattern is consistent with Kotlikoff and Spivak (1981). Generally, the insurance values of OASI are highly correlated with the standard deviation of lifespan across groups, with a correlation coefficient of 0.76.
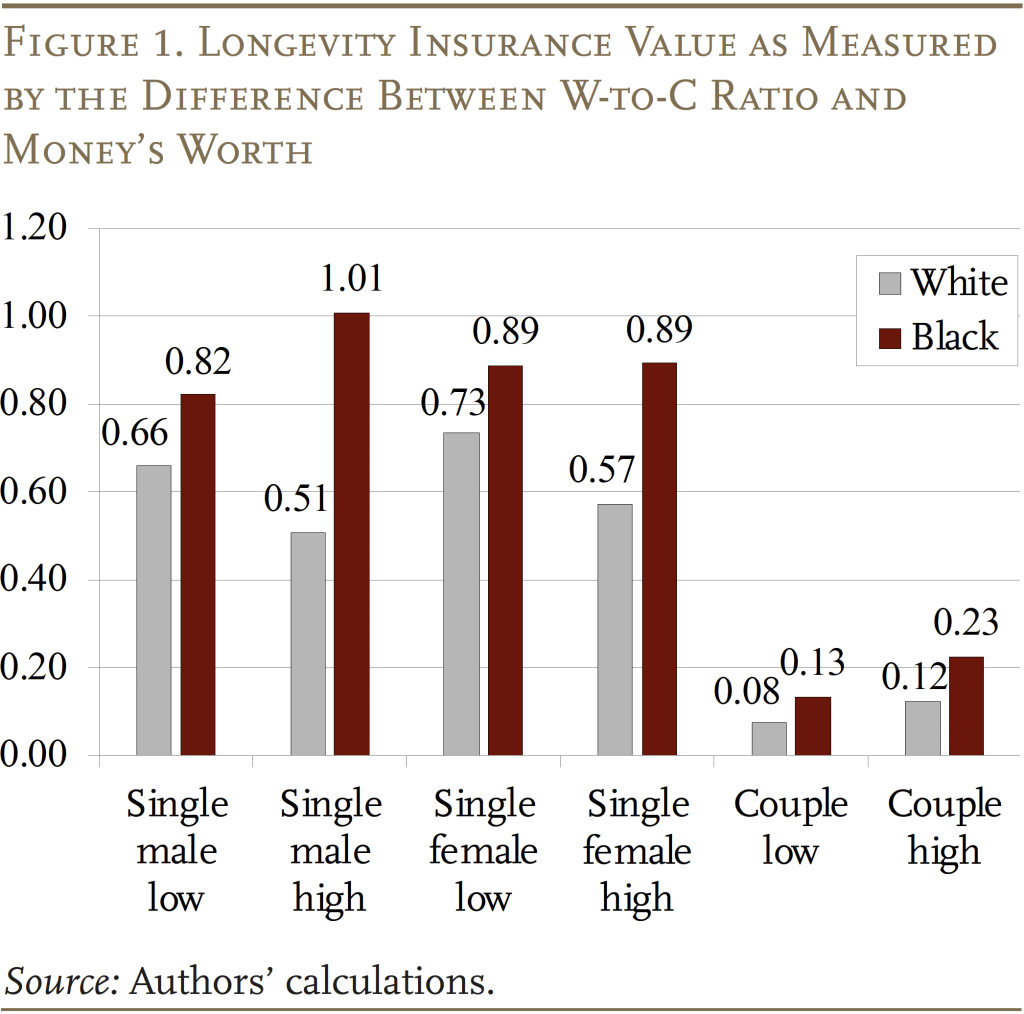
The results also show that Black households derive more insurance value from OASI than White ones within each household type-education group, consistent with the fact that Black households face greater longevity risk. This result suggests that OASI is an even more important factor in increasing equity in retirement security across racial groups than is suggested by the money’s worth of OASI.
Conclusion
The value of OASI for different racial and SES groups is commonly examined based on the program’s money’s worth, but this approach neglects its longevity insurance value, which is larger when the dispersion of longevity is greater. To calculate how the value of OASI differs across racial and SES groups incorporating the program’s longevity insurance value, this study calculates the wealth equivalence of OASI benefits using a lifecycle model for stylized households that differ by race, educational attainment, and marital status.
The results show that the wealth equivalence of OASI is at least as great as the lifetime OASI payroll taxes paid for almost all household types, regardless of race, gender, education, or household composition. This finding implies households generally prefer a world in which OASI exists to one in which it does not. Comparing the wealth equivalence with the money’s worth of OASI suggests that, once insurance value is accounted for, OASI increases racial equity in retirement security more than the money’s worth of OASI benefits suggests.
References
Arapakis, Karolos, Gal Wettstein, and Yimeng Yin. 2023. “What Is the Insurance Value of Social Security by Race and Socioeconomic Status?” Working Paper 2023-14. Chestnut Hill, MA: Center for Retirement Research at Boston College.
Clingman, Michael, Kyle Burkhalter, and Chris Chaplain. 2022. “Internal Real Rates of Return Under the OASDI Program for Hypothetical Workers.” Actuarial Note 2021.5. Baltimore, MD: U.S. Social Security Administration, Office of the Chief Actuary.
Kotlikoff, Laurence J. and Avia Spivak. 1981. “The Family as an Incomplete Annuities Market.” Journal of Political Economy 89(2): 372-391.
Leive, Adam A. and Christopher J. Ruhm. 2021. “Education Gradients in Life Expectancy by Gender and Race.” Working Paper 28419. Cambridge, MA: National Bureau of Economic Research.
Sanzenbacher, Geoffrey T. and Jorge D. Ramos-Mercado. 2016. “Calculating Expected Social Security Benefits by Race, Education, and Claiming Age.” Working Paper 2016-14. Chestnut Hill, MA: Center for Retirement Research at Boston College.
Sasson, Isaac. 2016. “Trends in Life Expectancy and Lifespan Variation by Educational Attainment: United States 1990-2010.” Demography 53(2): 269-293.
Wettstein, Gal, Alicia H. Munnell, Wenliang Hou, and Nilufer Gok. 2021. “The Value of Annuities.” Working Paper 2021-5. Chestnut Hill, MA: Center for Retirement Research at Boston College.
Endnotes
- 1Arapakis, Wettstein, and Yin (2023).
- 2Sanzenbacher and Ramos-Mercado (2016) and Clingman, Burkhalter, and Chaplain (2022).
- 3Sasson (2016) and Wettstein et al. (2021).
- 4Our methodology is similar to Wettstein et al. (2021), which simultaneously examined the insurance value and the money’s worth of different types of annuities by race and SES.
- 5Education is defined in relative terms. That is, the classification of individuals to low and high education is done in relation to the median education for that individual’s race-gender-cohort. This approach is similar to Leive and Ruhm (2021) and Wettstein et al. (2021); it accounts for possible selection on unobservable characteristics into higher education across race, gender, and cohort.
- 6Married couples are assumed to be heterosexual and have the same race and education for both members.
- 7The calculation follows a two-step approach, as in Wettstein et al. (2021).
- 8These benefits include the payments from Social Security to workers, and, in households married at age 65, the benefits also include spousal benefits due, if any, to the lower-earning spouse, and survivor benefits to surviving spouses after widowhood.
- 9Households in the model are allowed to save, but not borrow.
- 10Several caveats, however, pertain to this result. First, the model here assumes no bequest motives, no general equilibrium effects, and no late-life liquidity shocks (such as medical or long-term care expenses), all of which would reduce the value of OASI. Second, the model assumes no rate-of-return or inflation risks; which tends to understate the value of OASI benefits since they are insulated from financial markets and are indexed for inflation. Finally, the model assumes no income or capital gains taxes. The impact of this assumption could go either way.
- 11Taking the difference of these two measures captures the impact on the value of OASI of only the factors involved in the calculation of the W-to-C ratio but not in money’s worth, which include the variance of lifespan, initial wealth, and annuitized retirement income. We find that initial wealth and annuitized retirement income have very limited impact on the value of W-to-C ratios for all stylized households; thus, the difference between the W-to-C ratio and the money’s worth captures the variance of lifespan, which can be considered an approximate measure of OASI’s longevity insurance value.
- 12This pattern is consistent with Kotlikoff and Spivak (1981). Generally, the insurance values of OASI are highly correlated with the standard deviation of lifespan across groups, with a correlation coefficient of 0.76.


Wettstein, Gal, Karolos Arapakis, and Yimeng Yin. 2024. "What Is the Insurance Value of Social Security by Race and Education?" Issue in Brief 24-3. Chestnut Hill, MA: Center for Retirement Research at Boston College.