
How Well Do People Perceive Their Retirement Preparedness?

The brief’s key findings are:
- Most households in the National Retirement Risk Index have a good sense of whether they are on track for retirement:
- 40 percent are in good shape and know it.
- 20 percent are in trouble and know it.
- The rest are either “not worried enough” or “too worried.”
- Those “not worried enough” are more likely to have higher incomes and may misjudge how much their assets can provide.
- While this group is in the most danger of saving too little, even those who do recognize they are in trouble may not act unless prodded.
Introduction
The National Retirement Risk Index (NRRI) measures the percentage of working-age households that is at risk of being financially unprepared for retirement. Since the Great Recession, the calculations show that even if households work to age 65 and annuitize all their financial assets, including the receipts from reverse mortgages on their homes, roughly half of households are at risk of being unable to maintain their standard of living.
This brief examines whether households have a good sense of their own retirement preparedness – do their expectations match the reality they face? That is, do households at risk know they are at risk? Understanding households’ self-assessed retirement preparedness is important because misperceptions can distort saving behaviors. Households that are not worried enough about their retirement income may not save enough even if they have the opportunity; households that are too worried may unnecessarily sacrifice their pre-retirement standard of living.
The discussion proceeds as follows. The first section summarizes the NRRI. The second section compares households’ self-assessed preparedness to the objective measure provided by the NRRI to gauge whether households have accurate perceptions and how those perceptions have changed over time. The third section identifies the characteristics of the households with inaccurate perceptions – those that are either “not worried enough” or “too worried.” The final section concludes that almost 60 percent of self-assessments agree with the NRRI results and that the 40 percent of households that get it wrong do so for predictable reasons. The issue remains, however, whether unprepared households that recognize their situation are any more likely to take corrective action than those that do not.
The NRRI
The NRRI is based on the Federal Reserve’s Survey of Consumer Finances (SCF), a triennial survey of a nationally representative sample of U.S. households. The Index calculates, for each SCF household, a replacement rate – projected retirement income as a percentage of pre-retirement earnings – and compares that replacement rate with a target rate derived from a consumption smoothing model. Those who fail to come within 10 percent of the target are defined as “at risk,” and the Index reports the percentage of all households at risk (see Figure 1).1For more details on the NRRI model, see Yin, Chen, and Munnell (2023).
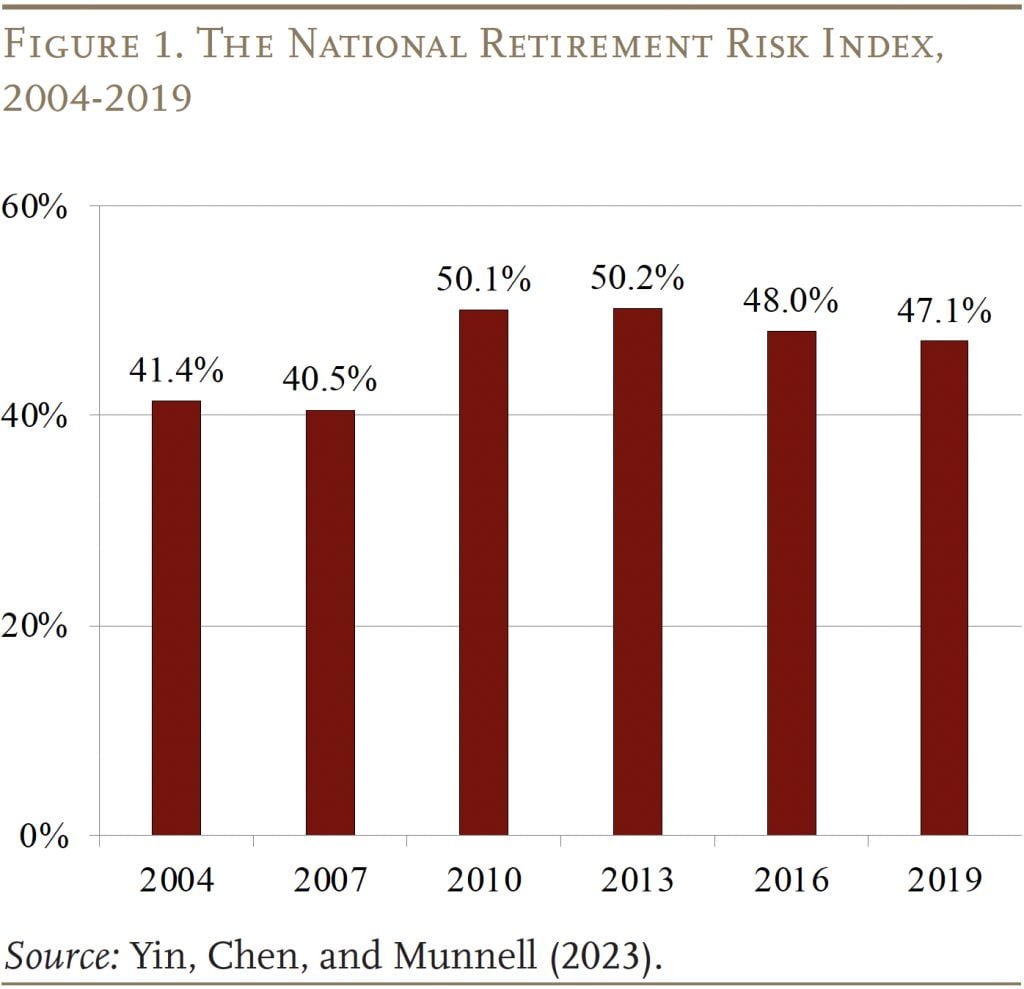
The Index rose substantially between 2007 and 2010 as a result of the Great Recession, and then recovered slowly from 2013 to 2019 as the economy enjoyed low unemployment, rising wages, strong stock market growth, and rising housing prices. The improvements in the NRRI during the recovery were modest due to some countervailing longer-term trends – such as the gradual rise in Social Security’s Full Retirement Age (FRA) and the continued decline in interest rates – which made it more difficult for households to achieve retirement readiness.
Household Assessments vs. the NRRI
The SCF, which is used to construct the NRRI, also asks each household to rate the adequacy of its anticipated retirement income. The question’s response scale is from one to five, with one being “totally inadequate,” three being “enough to maintain living standards,” and five being “very satisfactory.” Thus, any household that answers one or two considers itself to be at risk.2A mismatch could exist between the intent of the SCF’s self-assessment question and the NRRI model. In the self-assessment, the middle option is defined as “enough to maintain living standards” but, in the NRRI, maintaining living standards is considered the goal.
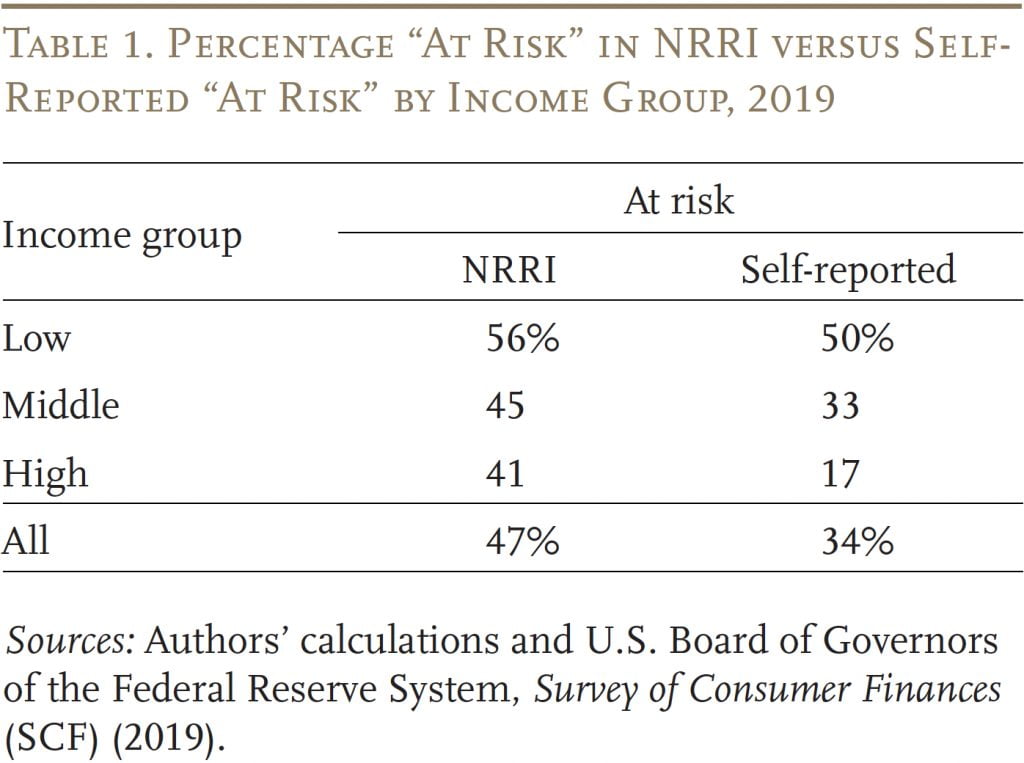
Comparing households’ self-assessed retirement preparedness to the NRRI’s predictions in 2019 shows that households across the income distribution underestimate their level of risk (see Table 1). Only about one third of households self-report being at risk while the NRRI predicts that nearly one half are at risk of not having enough for retirement.3It is important to note that the practical meaning of “at risk” differs by income. For example, at-risk households with very low income may have trouble affording basic necessities. In contrast, at-risk households with high income are not in danger of falling into poverty. However, they do face the prospect of a difficult adjustment that may require them to lower their expectations of their retirement lifestyle. Interestingly, higher-income households are most likely to underestimate their risk.
The gap between self-assessed views of adequate preparedness and the NRRI has not always been so large. Prior to 2016, the share of households that self-reported being at risk was relatively consistent with the NRRI and, in fact, slightly higher (see Figure 2). However, in 2016, it dropped substantially.
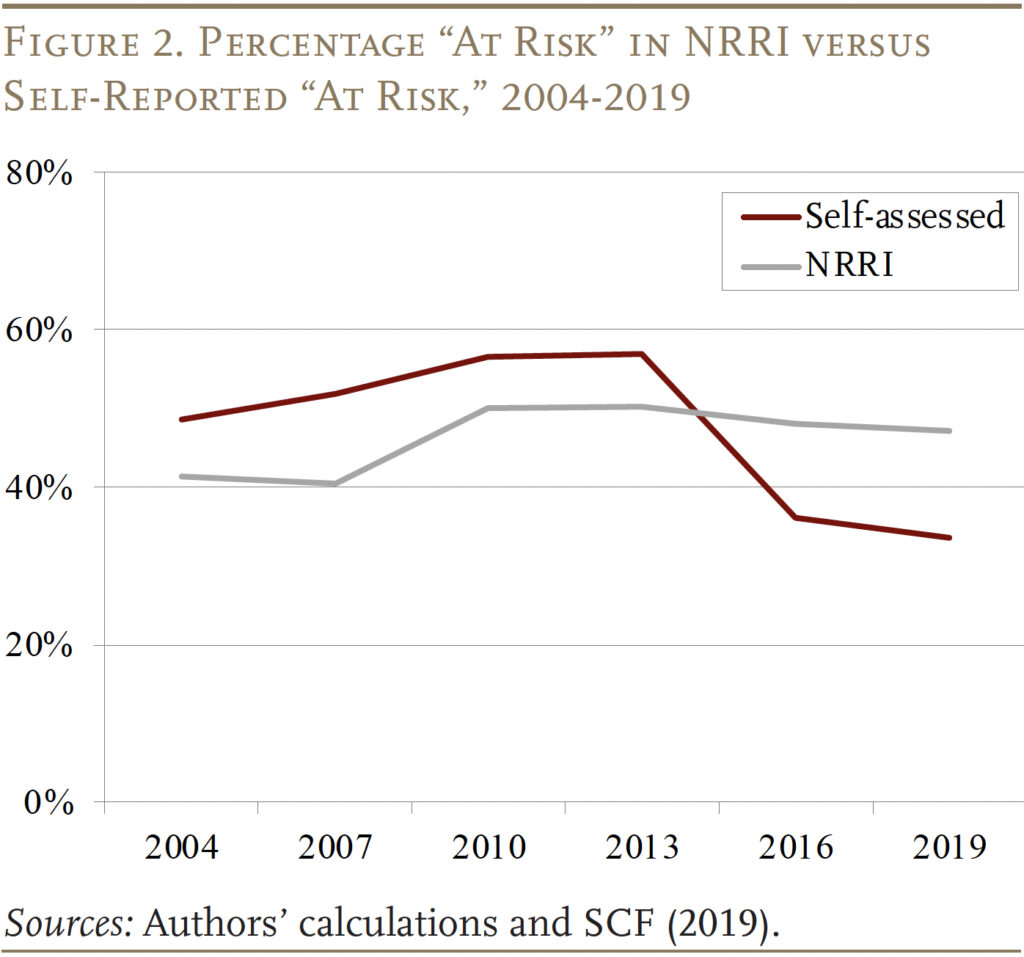
A potential explanation for this sharp decline is that the SCF question changed in 2016. Prior to 2016, households were asked to assess the adequacy of their retirement income from Social Security and employer pensions, including 401(k)s/IRAs. After 2016, households were asked to consider all sources of retirement income, which could now include housing wealth and other financial assets. After the change, the share of households rating their retirement income as “inadequate” or “totally inadequate” fell from 57 percent in 2013 to 36 percent in 2016 and 34 percent in 2019, with high-income households reporting the steepest drop. Despite the decline, the SCF responses remain within the range shown by other surveys of retirement preparedness – a range that includes the NRRI estimates as well (see Box).
Box. What Do Other Surveys Show?
Interestingly, other surveys show a range of results that bracket both the SCF and NRRI numbers (see Table).
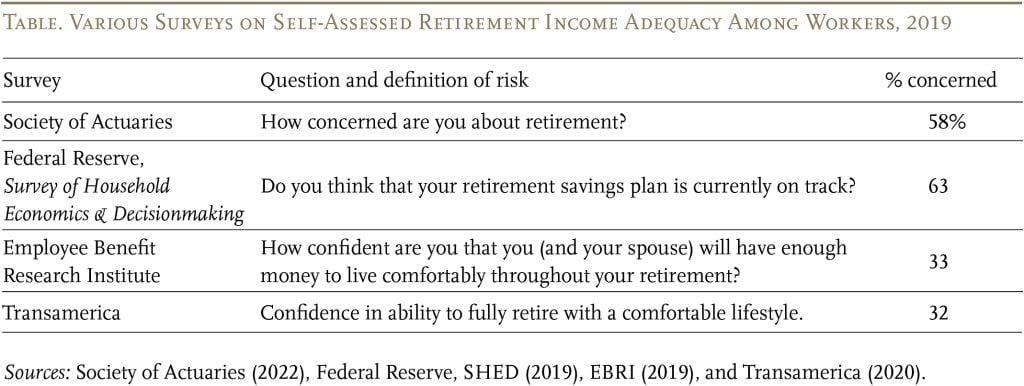
Experts point out that the wording of the question matters. Specifically, negative or positive phrasing can impact responses due to acquiescence bias, where respondents agree with the question asked.4Billiet and McClendon (2000); Jackson (1959), and Welkenhuysen-Gybels, Billiet, and Cambré (2003). Surveys in which a high share of households report concern for their retirement income use negative or neutral words like “concerned” or “on-track,” while surveys that report a low share use positive words like “confident/confidence.”
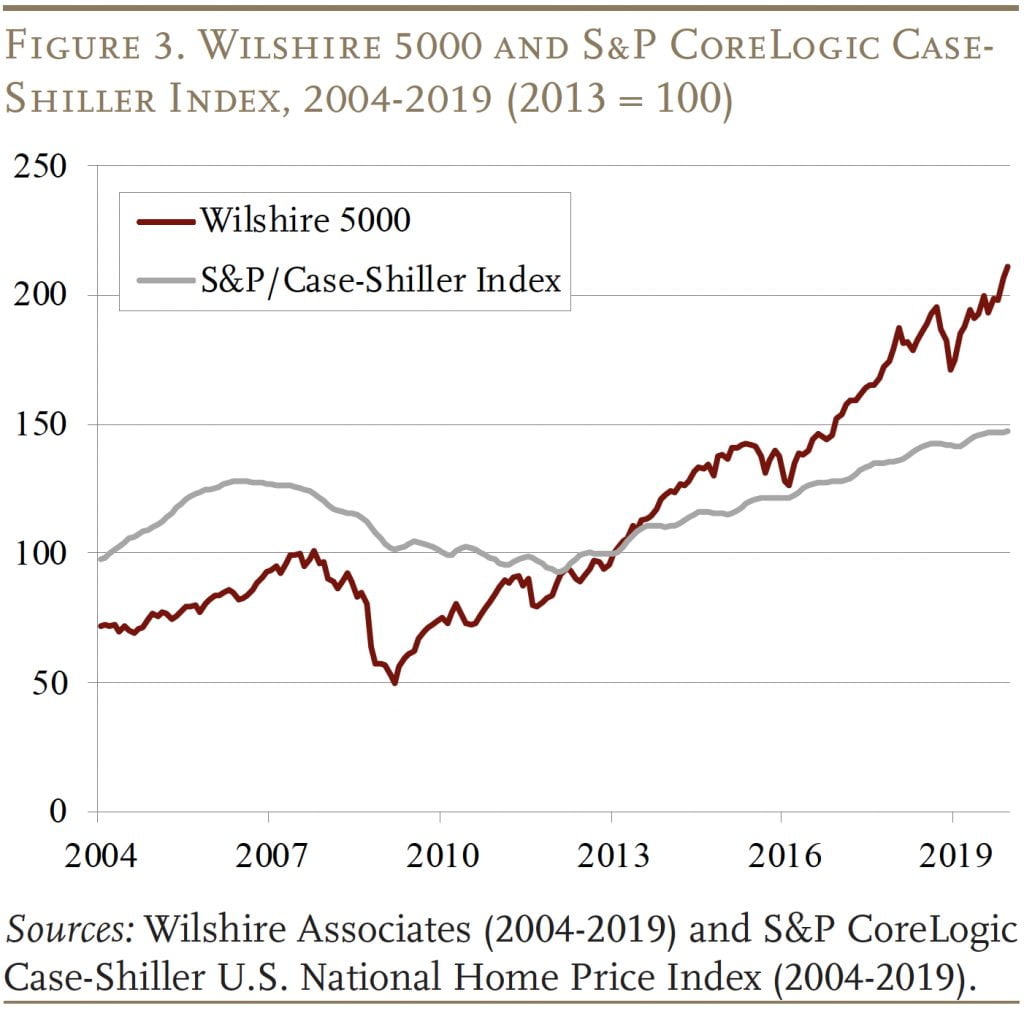
Like the revised SCF question, the NRRI includes housing and financial assets when evaluating whether a household is at risk. So the sharp decline in self-assessed risk in the SCF after the question change suggests that households are more optimistic about the amount of income their housing and non-retirement assets can provide than the NRRI predicts. This optimism, particularly among higher-income households, may be due to a strong rebound of the housing and stock markets during this period (see Figure 3).
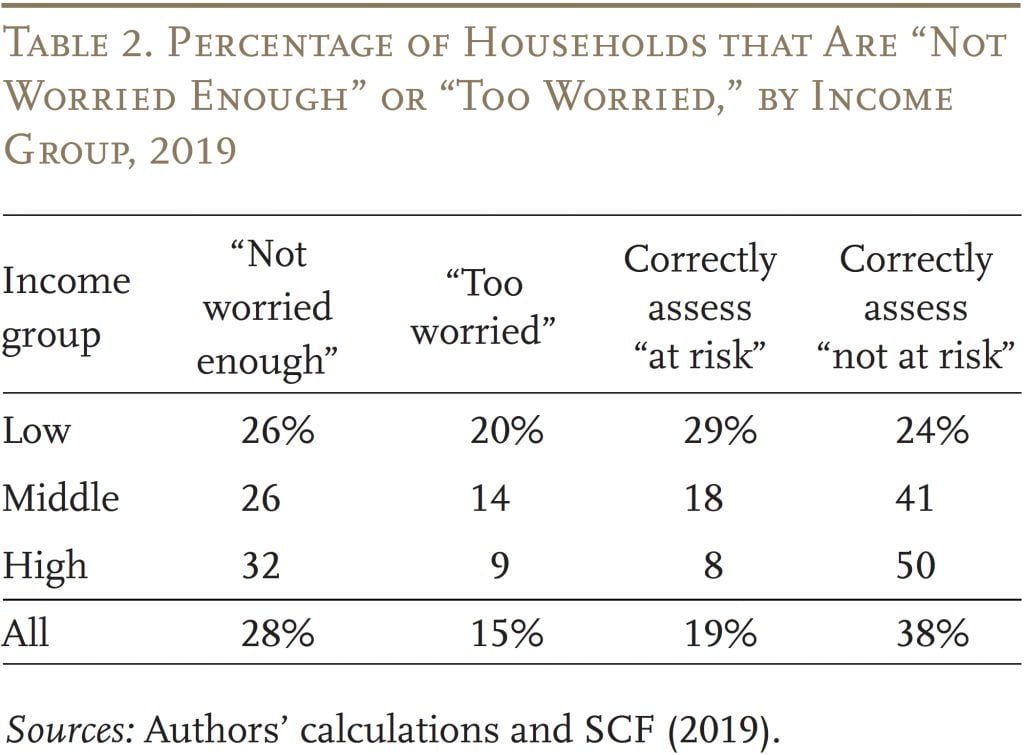
When comparing individual household assessments with the NRRI, 28 percent think they are not at risk while the NRRI predicts they are (this group is “not worried enough”), and 15 percent think they will fall short while the model predicts they will have enough (“too worried”) (see Table 2). Results by income show that high-income households – perhaps overreacting to the impact of the strong economy on housing and stock prices – are the most likely to be “not worried enough” and low-income households are the most likely to be “too worried.” The remaining 57 percent get it right, with 19 percent correctly rating they are at risk and 38 percent correctly rating they are not at risk.
What Explains Misperceptions?
The question is what characteristics are associated with a household being “not worried enough” or “too worried,” as opposed to getting it right. The analysis uses regressions to explain the probability of households ending up in a given category using a variety of factors, including: retirement plan participation and account balance, homeownership and housing wealth, risk aversion, self-assessed financial knowledge, education, household type, race/ethnicity, and age. The analysis is conducted separately for the low-, middle-, and high-income households because the importance of the explanatory variables may differ across the income distribution. The major reasons for being “not worried enough” or “too worried” are summarized below. Full results are available in the Appendix.
Major Reasons for “Not Worried Enough”
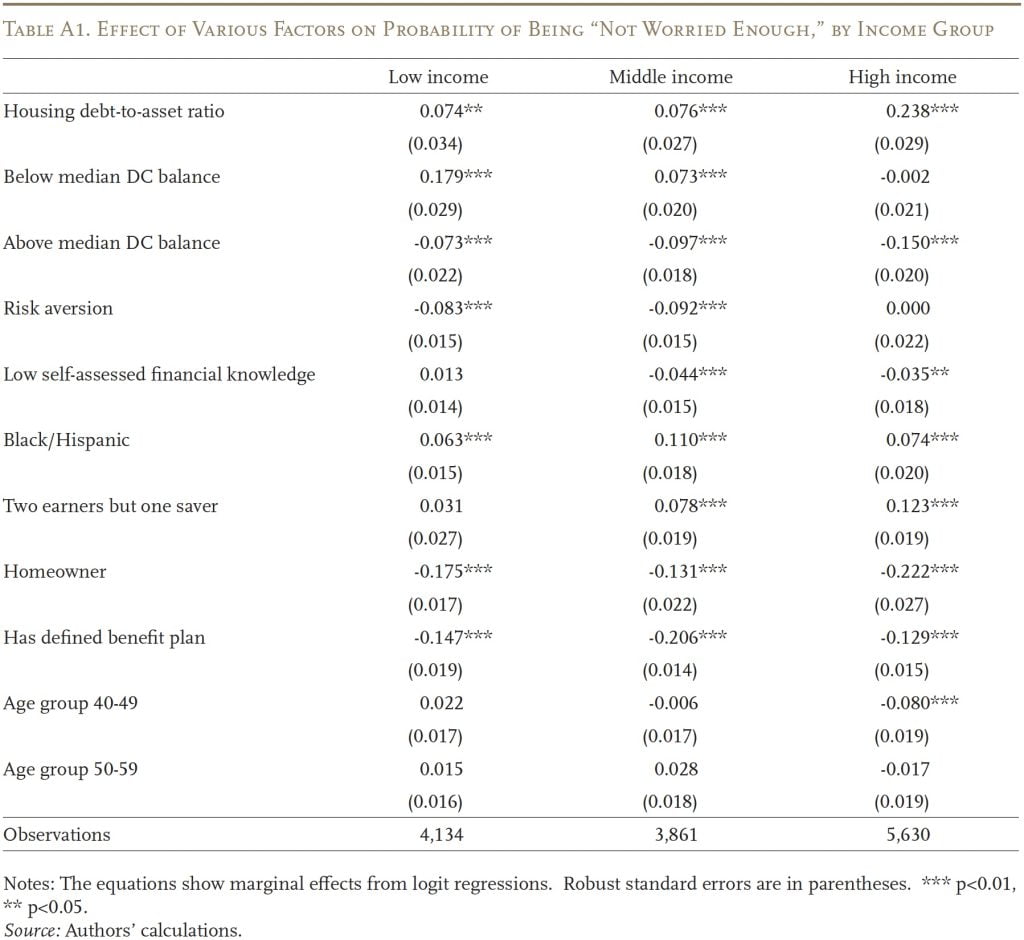
Conceptually, households that were overly optimistic about the economic recovery or overestimated how much income their assets could provide may be more likely to be “not worried enough.” Their overconfidence may lead them to underestimate possible risks. Therefore, it is not surprising that households with higher housing debt-to-asset ratios, relatively low asset balances in 401(k)s and other defined contribution (DC) plans, and two earners but only one saver were more likely to be “not worried enough” (See Figure 4).5See Appendix Table A1 for the full results.
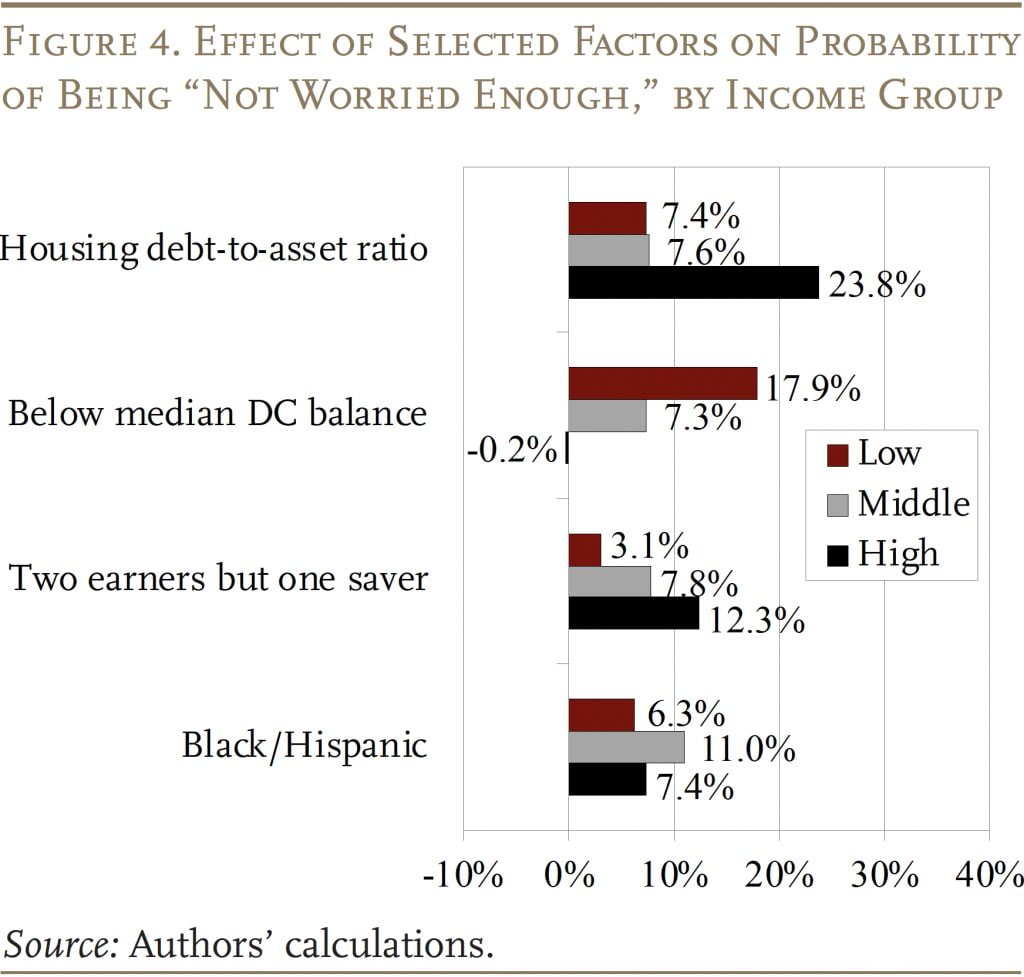
Housing debt-to-asset ratio. As the housing market improved, households may have been comforted by the rising value of their asset, without considering how much they still owed. The positive relationship between the housing debt-to-asset ratio and the “not worried enough” group is especially strong for high-income households, who tend to own more expensive homes.
Below median DC balance. Similarly, the danger with DC plan assets is “wealth illusion.” That is, $100,000 looks like a lot of money to many people even though it provides only about $617 per month in retirement income.6This estimate is the current market rate for a single immediate annuity for a male, age 65, living in Massachusetts. This wealth illusion may have been exacerbated by the strong market performance. Having only a modest DC balance is associated with a higher probability of being “not worried enough” for low and middle-income households.7Our results confirm prior findings that the “wealth illusion” tends to decrease as DC account balances increase (Goldstein, Hershfield, and Benartzi 2016).
Two earners but one saver. Many dual-earner households may not realize they will have to replace both spouses’ earnings to maintain their standard of living in retirement.8See Sanzenbacher and Hou (2019). So, not surprisingly, dual-earner households where only one spouse has a retirement plan are more likely to be “not worried enough.” This probability also increases with income because Social Security replaces a smaller share of pre-retirement income for high earners.
Black/Hispanic. Black and Hispanic households are also more likely to be “not worried enough,” perhaps due to racial/ethnic gaps in financial literacy.9See Lusardi and Mitchell (2011), who also show that people who score higher on financial literacy questions are much more likely to plan for retirement.
Major Reasons for “Too Worried”
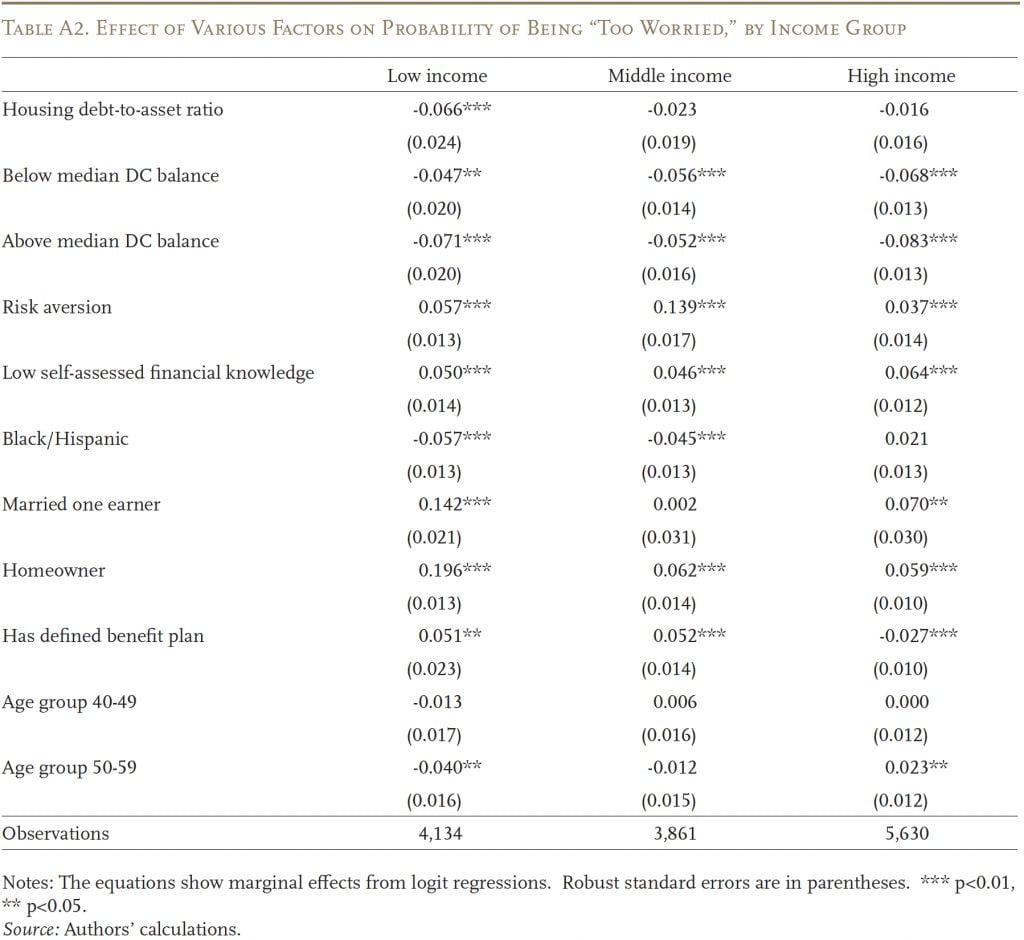
Unlike overly optimistic households, those who are “too worried” are not aware of how much income they will have in retirement and perhaps have less optimism in the asset markets. Characteristics that capture these factors – such as risk aversion, married one-earner households, homeowner, and low self-assessed financial knowledge – predicted households’ likelihood of being “too worried” (see Figure 5).10See Appendix Table A2 for the full results.
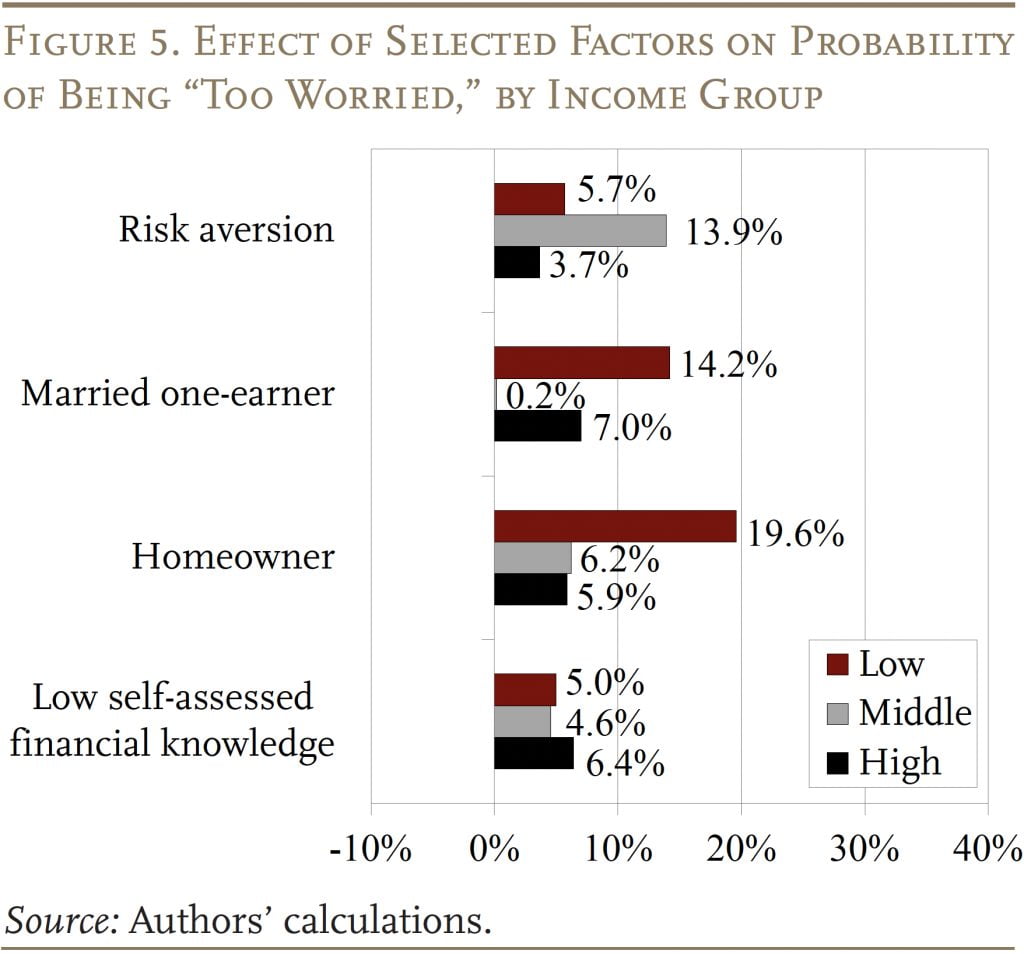
Risk aversion. Households who are risk averse might be more conservative when judging their financial situation and less likely to be swayed by optimism in the asset markets. Therefore, it is not surprising that risk-averse households are more likely to be “too worried.”11Interestingly, the link between risk aversion and being “too worried” is largest for middle-income households, perhaps because lower-income households typically do not have a lot of wealth to worry about while higher-income households feel financially secure, regardless of whether they actually are.
Married one-earner. Single-earner households may not take account of Social Security’s spousal benefit – equal to 50 percent of the benefit of the working spouse – when evaluating their retirement income. Perhaps for this reason, married low-income households with only one earner have a higher probability of being “too worried.”
Homeowner. Homeowners are more likely to be “too worried” because they do not plan to tap their home equity to support general consumption in retirement. The effect is especially large for low-income homeowners because their home represents a much higher portion of their total net worth.
Low self-assessed financial knowledge. Households that rate themselves as having low financial knowledge may be less confident or aware of their financial situation. Interestingly, these households are doing better than they think, as they are more likely to be “too worried.”
Overall, the results suggest that households with incorrect perceptions get it wrong for predictable reasons. A little education about the value of various sources of retirement income could reduce the size of the “too worried” group.
Conclusion
Despite research showing households have large gaps in financial knowledge, nearly three out of five have a good gut sense of their financial situation. This share has remained relatively constant despite a 2016 change in the SCF survey. However, classifying households by the accuracy of their perceptions about retirement security does not answer the question of whether they are likely to take remedial action. Households that are “not worried enough” are the least likely to change their saving or retirement plans. This group accounts for 28 percent of households, so a significant portion of the population needs to get a better assessment of their retirement income needs. The additional one-fifth of households that do understand their plight may need less convincing to act, but they still must act.
References
Billiet, Jaak B. and McKee J. McClendon. 2000. “Modeling Acquiescence in Measurement Models for Two Balanced Sets of Items.” Structural Equation Modeling 7(4): 608-628.
Employee Benefit Research Institute. 2019. “2019 RCS Fact Sheet #1 Retirement Confidence.” Washington, DC.
Goldstein, Daniel G., Hal E. Hershfield, and Shlomo Benartzi. 2016. “The Illusion of Wealth and Its Reversal.” Journal of Marketing Research 53(5): 804-813.
Jackson, Douglas N. 1959. “Cognitive Energy Level, Acquiescence, and Authoritarianism.” The Journal of Social Psychology 49(1): 65-69.
Sanzenbacher, Geoffrey T. and Wenliang Hou. 2019. “Do Individuals Know When They Should Be Saving for a Spouse?” Issue in Brief 19-5. Chestnut Hill, MA: Center for Retirement Research at Boston College.
Society of Actuaries. 2022. “2021 Retirement Risk Survey Report of Findings.” Schaumburg, IL.
Transamerica Center for Retirement Studies. 2020. “Retirement Security Amid COVID-19: The Outlook of Three Generations.” 20th Annual Transamerica Retirement Survey of Workers. Cedar Rapids, IA.
U.S. Board of Governors of the Federal Reserve System. Survey of Consumer Finances, 2004-2019.
U.S. Board of Governors of the Federal Reserve System. Survey of Household Economics and Decisionmaking, 2019.
Welkenhuysen-Gybels, Jerry, Jaak Billiet, and Bart Cambré. 2003. “Adjustment for Acquiescence in the Assessment of the Construct Equivalence of Likert-Type Score Items.” Journal of Cross-Cultural Psychology 34(6): 702-722.
Yin, Yimeng, Anqi Chen, and Alicia H. Munnell 2023. “The National Retirement Risk Index: Version 2.0.” Issue in Brief 23-10. Chestnut Hill, MA: Center for Retirement Research at Boston College.
Appendix
Endnotes
- 1For more details on the NRRI model, see Yin, Chen, and Munnell (2023).
- 2A mismatch could exist between the intent of the SCF’s self-assessment question and the NRRI model. In the self-assessment, the middle option is defined as “enough to maintain living standards” but, in the NRRI, maintaining living standards is considered the goal.
- 3It is important to note that the practical meaning of “at risk” differs by income. For example, at-risk households with very low income may have trouble affording basic necessities. In contrast, at-risk households with high income are not in danger of falling into poverty. However, they do face the prospect of a difficult adjustment that may require them to lower their expectations of their retirement lifestyle.
- 4Billiet and McClendon (2000); Jackson (1959), and Welkenhuysen-Gybels, Billiet, and Cambré (2003).
- 5See Appendix Table A1 for the full results.
- 6This estimate is the current market rate for a single immediate annuity for a male, age 65, living in Massachusetts.
- 7Our results confirm prior findings that the “wealth illusion” tends to decrease as DC account balances increase (Goldstein, Hershfield, and Benartzi 2016).
- 8See Sanzenbacher and Hou (2019).
- 9See Lusardi and Mitchell (2011), who also show that people who score higher on financial literacy questions are much more likely to plan for retirement.
- 10See Appendix Table A2 for the full results.
- 11Interestingly, the link between risk aversion and being “too worried” is largest for middle-income households, perhaps because lower-income households typically do not have a lot of wealth to worry about while higher-income households feel financially secure, regardless of whether they actually are.


Chen, Anqi, Yimeng Yin, and Alicia H. Munnell. 2023. "How Well Do People Perceive Their Retirement Preparedness?" Issue in Brief 23-12. Chestnut Hill, MA: Center for Retirement Research at Boston College.