
What Drives the Racial Housing Wealth Gap for Older Homeowners?

The brief’s key findings are:
- Black homeowners have less housing wealth than White homeowners. This study explores the reasons for the wealth gap at age 55.
- Black homeowners faced obstacles at every step – from accumulating a down payment to buying in attractive areas to accessing credit to upsize.
- The analysis compares similar Black and White households to see what share of the wealth gap is due to the early hurdles vs. slower appreciation.
- The results show that both factors – smaller down payments and slower growth in home values – were equally important contributors to the gap.
Introduction
Homeownership is one of the largest sources of retirement wealth for most households and is promoted as a key tool for wealth accumulation. However, a long history of discrimination in the housing market has constrained the ability of Black households to accumulate housing wealth relative to their White counterparts.1Munnell et al. (1996). Consequently, Black households approaching retirement are less likely to own homes and, when they do, they see lower wealth accumulation compared to White homeowners. This brief, which is based on a recent paper, focuses on the homeowners.2Liu and Quinby (2023).
The goal is to determine what share of the age-55 housing wealth gap is due to disadvantage at the time of first purchase – namely, less parental assistance with the mortgage down payment – and what share is due to slower appreciation of subsequent housing wealth? To isolate the impact of these factors, the analysis compares older Black and White homeowners who seem equally able to accumulate housing wealth based on their socioeconomic characteristics, but who still ended up with different outcomes.
The discussion proceeds as follows. The first section provides background on how older Black families faced disadvantage in nearly every aspect of the housing market. The second section outlines the data and methodology used to evaluate the racial housing wealth gap over the lifecycle for otherwise similar homeowners. The third section presents the results, which show that both factors – disparities at first purchase and subsequent appreciation – play an important role in explaining the gap at age 55. The final section concludes that future research should consider how structural changes in the housing market over the past 30 years might have alleviated some barriers for younger homebuyers.
Background
The explanation for the racial housing wealth gap among households approaching retirement begins early in the lifecycle. Lower household incomes hinder the ability of Black families to save for a down payment and access the financial services needed to purchase a first home.3For example, see Aaronson, Hartley, and Mazumder (2021) and Faber (2021). Even among households with similar income, Black families often lack generational wealth, making them less likely to receive assistance from their parents on a down payment.4Bond and Eriksen (2021). Previous studies find that young White households are three times as likely as Black households to receive parental assistance for a home purchase, resulting in a higher mortgage approval rate and facilitating homeownership at a slightly younger age.5Choi and Goodman (2018); Lee et al. (2020); and Charles and Hurst (2002). Moreover, older Black households faced pervasive discrimination in mortgage lending during the 1980s and 1990s, although recent evidence shows that discriminatory lending has largely abated due to increased regulation and widespread adoption of automated underwriting systems.6Bhutta, Hizmo, and Ringo (2022). Similarly, recent studies no longer find evidence of discrimination in mortgage pricing (see, for example, Bartlett et al. 2022).
When Black households eventually transition into homeownership, they are constrained to purchase less valuable first homes.7Choi, McCargo, and Goodman (2019) and Neal, Choi, and Walsh (2020). In addition to having a smaller down payment, Black households are rarely able to purchase homes with the same amenities as White households because of historical redlining that pushed Black families into segregated neighborhoods with less public investment. Residential segregation not only limits the purchase price of Black homes, but also depresses subsequent growth in the value of the house.8Di, Belsky, and Liu (2007); Newman and Holupka (2016); Mayock and Malacrida (2018); and Markley et al. (2020). Lower appreciation could also push Black households to invest less in their homes since other asset classes perform relatively better. Since families typically live in the same house for long periods, slower appreciation leads to much lower compounding and ultimately, lower housing values.9Additionally, Black buyers typically pay a premium to purchase their home due to pervasive price discrimination (Bayer et al. 2017; Ihlanfeldt and Mayock 2009; Myers 2004; and Zonta 2019). And similar discrimination in home appraisals raises the amount of property taxes levied on Black homes (Amornsiripanitch 2020; Avenancio-Leon and Howard 2022; and Berry 2021).
Finally, Black households are more likely to sell or lose their home, a phenomenon that was particularly stark during the financial crisis of 2008.10Bayer, Ferreira, and Ross (2016). Indeed, one recent study argues that disparities in distressed home sales explain most of the racial gap in appreciation rates.11Kermani and Wong (2021). However, since the goal here is to evaluate the racial housing wealth gap between homeowners approaching retirement, families who lose their house drop out of our sample entirely.
Given that Black households face disadvantage in nearly every aspect of the housing market, this brief asks a simple question: what share of the housing wealth gap among older Black and White homeowners is due to disparities at the time of first purchase, and what share is due to slower appreciation over the course of homeownership?
Data and Methodology
This analysis relies on the Panel Study of Income Dynamics (PSID), a nationally representative survey conducted since 1968, which includes extensive information on homeownership and housing wealth accumulation, and race. The analysis focuses on Black and White households who buy their first home between 1980-2000 and follows them through 2019, limiting the sample to those who are still homeowners at age 55.12Specifically, we follow households until the financial respondent (typically the primary earner) is age 55. Since some households transition between renter and homeowner multiple times, the sample is further limited to households that remain homeowners consistently from the time of first purchase to age 55. And the focus is on the primary residence rather than wealth built through vacation or investment properties since a majority of households own only one home.
The goal is to compare older Black and White homeowners who, based on their own socioeconomic characteristics, might seem equally well situated to accumulate housing wealth. The extent to which Black households fall short in this comparison reflects two sources of structural disadvantage: the lack of parental assistance and persistent discrimination in the housing market. The analysis regresses housing wealth at initial purchase and age 55 (measured in logs and net of mortgage debt) on household income and other demographic characteristics:
Housing wealth = ƒ(Black, log income, household demographics)
The independent variable of interest is the Black indicator, which reflects the racial gap in housing wealth holding income and demographics constant. To present the results from these regressions in an intuitive way, the coefficients are used to simulate housing wealth for hypothetical Black and White families who are assumed to have the same characteristics (chosen to be representative of the PSID sample).
Results
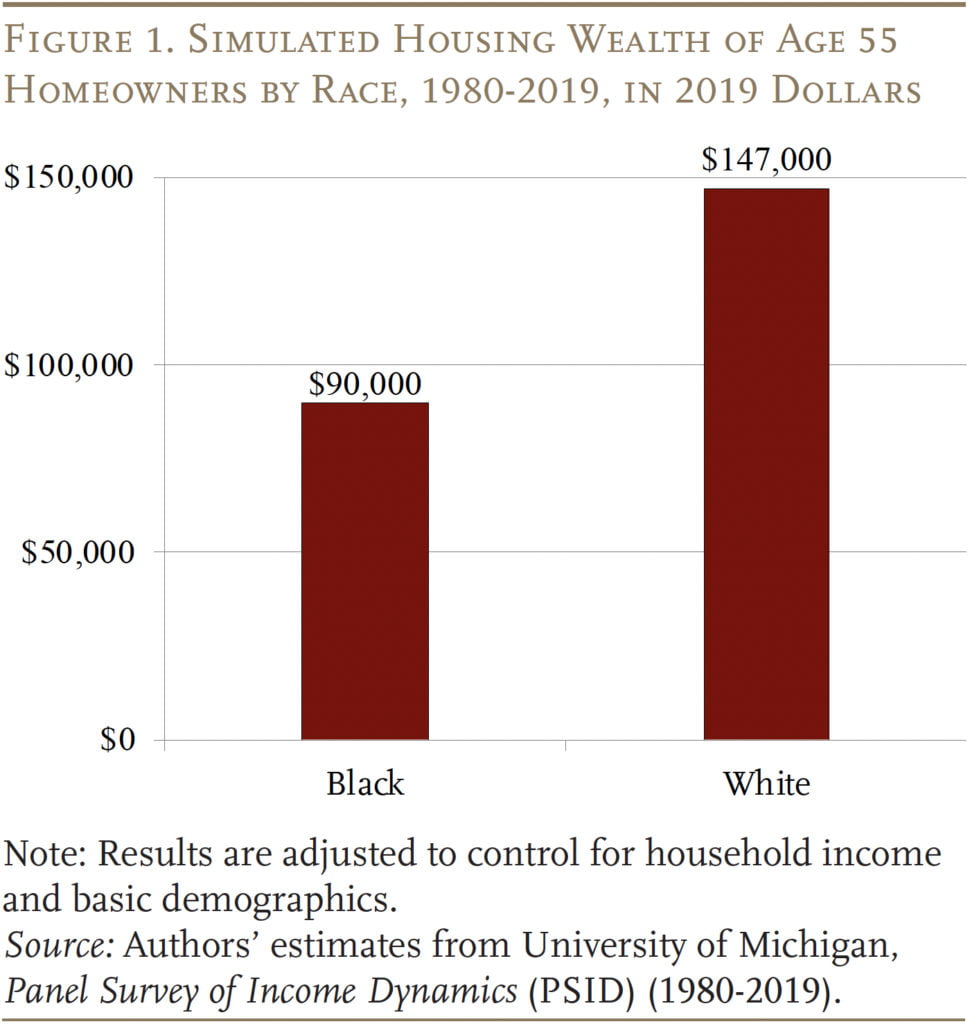
To set the stage for the main results, Figure 1 compares housing wealth at age 55 for the hypothetical Black and White households. As expected, after controlling for income and basic demographics, Black homeowners approaching retirement have only 61 percent of the housing wealth held by older White homeowners.
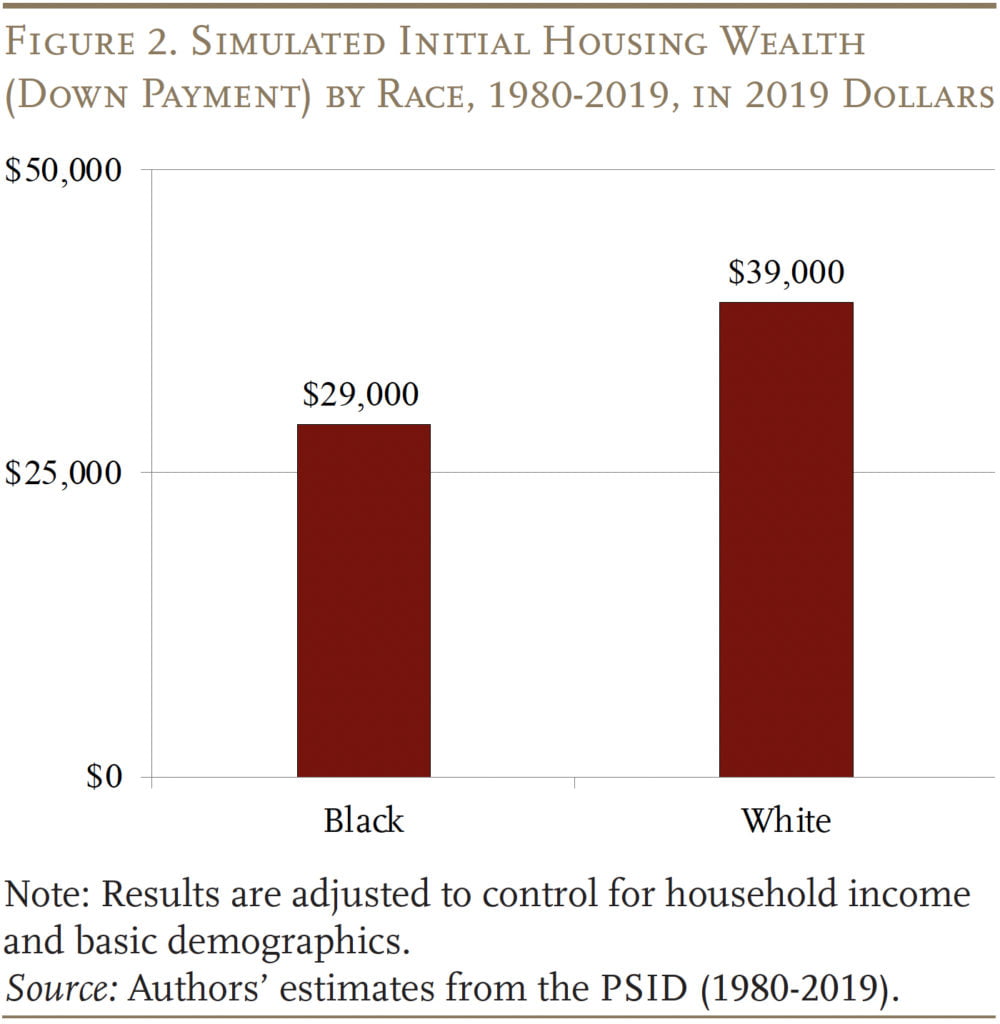
To understand the drivers of this gap, the first step is to consider housing market experiences in young adulthood. Initial housing wealth is simply the household’s down payment (first house price less mortgage principal); as expected, Black households approached the housing market with fewer resources to invest. Specifically, initial housing wealth for Black households was only 74 percent of initial wealth for their otherwise-similar White counterparts (see Figure 2).
Because of this resource deficit, Black households ended up buying less expensive first homes than White households.13Specifically, the purchase price of Black-owned homes in our analysis was 15 percent less. In theory, smaller down payments could have resulted from Black households taking on more debt to acquire homes of similar value to White households. However, the simulated loan-to-value ratio is almost identical. They also bought them slightly later (see first row of Table 1). Consequently, Black families had a little less time to see their houses grow in value and pay down their debt before age 55.
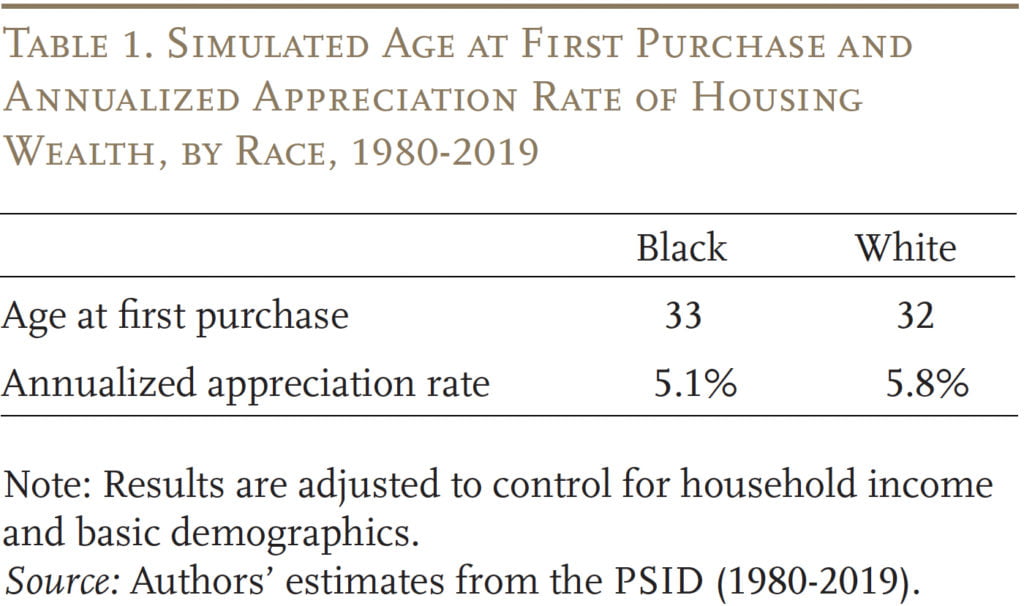
Not only did older Black homeowners start from a weaker position, but their housing wealth also grew more slowly over time. The second row of Table 1 calculates the internal rate of return that, when applied to the down payment, yields housing wealth at age 55. For both Black and White homeowners, this internal rate of return exceeds the annual appreciation rate of the house itself (around 2 percent during this period) because housing is a highly leveraged investment. Nevertheless, Black housing wealth grew 0.7 percentage points slower per year. Compounded over two decades, this annual appreciation penalty explains most of the cumulative difference in the growth of housing wealth.
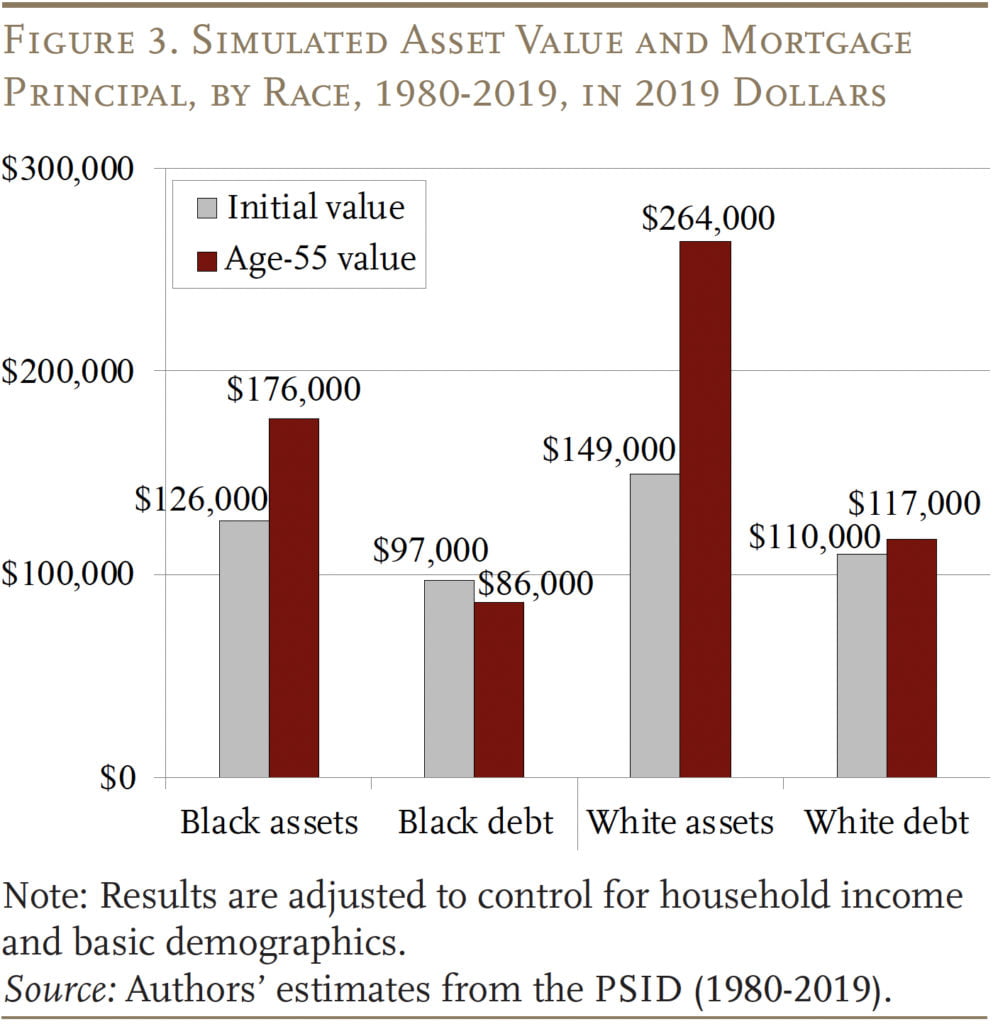
From a policy perspective, one might wonder what caused such a stark difference in appreciation: weak growth in the value of Black-owned homes, or slower amortization of mortgage debt? Hence, Figure 3 breaks wealth into its components: the asset value of the house and the remaining mortgage principal. On the asset side, the value of Black-owned homes grew by only 40 percent (from $126,000 to $176,000), compared to 77 percent for homes owned by White households (from $149,000 to $264,000). On the debt side, remaining mortgage principal dropped by 11 percent for Black households, but actually grew slightly for White households between the time of first purchase and age 55.
The growth in debt for White households may seem surprising given that, by age-55, households had been making mortgage payments for two decades. It turns out that many older households traded their “starter home” for a larger, more valuable house with higher appreciation, and financed the purchase with additional debt. Black households were 26 percent less likely to take advantage of this leveraged upsizing. And when they did, they borrowed less. In addition, older White households were more likely to refinance their original mortgage as interest rates fell, and some of these transactions were cash-out refinances.14See Liu and Quinby (2023) for details. Although they are infrequently discussed in the literature on mortgage lending, both of these factors suggest that racial barriers to accessing credit persisted over the lifecycle for this cohort of older homeowners.
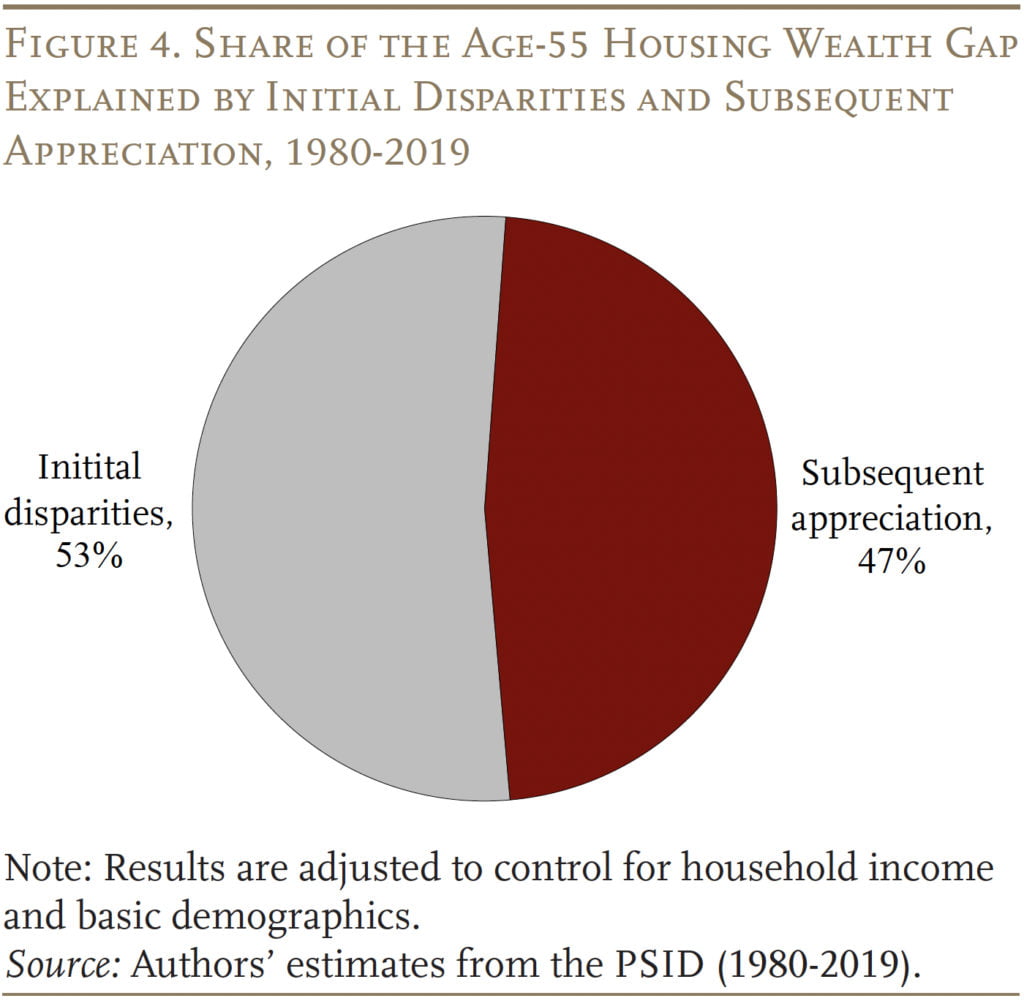
Ultimately, the goal of this brief is to determine what share of the age-55 wealth gap is driven by initial disparities, and what share is due to subsequent appreciation. So as a final exercise we conduct a thought experiment: how large would the age-55 gap have been had Black households started off with the same initial housing wealth as White households, but then subsequently earned their actual, lower appreciation rate? Figure 4 presents the results, with initial disparities accounting for 53 percent of the actual gap and slower appreciation generating the other 47 percent. However, the exact share is sensitive to how the thought experiment is framed.15For instance, if we run the inverse thought experiment – asking how large the age-55 gap would have been had Black households started off with their actual initial housing wealth, but had subsequently earned the faster White appreciation rate – we find that initial disparities account for 64 percent of the age-55 gap, and appreciation the other 36 percent.
Conclusion
Black families face disadvantage in nearly every aspect of the housing market. Consequently, Black households approaching retirement are less likely to own homes than White households; and even among homeowners with similar household income and demographics, older Black households have less housing wealth than their White counterparts. Hence, this brief addressed a simple question: what share of the housing wealth gap at age 55 is due to adverse experiences at the time of first purchase – namely, fewer resources to support a down payment – and what share is due to slower appreciation in subsequent years? Although the exact answer is somewhat sensitive to the details of the analysis, the conclusion is clear – each factor contributed meaningfully to the age-55 gap.
Closing the housing wealth gap is a complex problem to solve. However, in at least one aspect of the housing market – mortgage lending – conditions seem to be improving for young Black homebuyers. Hence, future research should consider how structural changes in the housing market over the past 30 years could reduce the age-55 housing wealth gap moving forward.
References
Aaronson, Daniel, Daniel Hartley, and Bhashkar Mazumder. 2021. “The Effects of the 1930s HOLC ‘Redlining’ Maps.” American Economic Journal: Economic Policy 13(4): 355-392.
Amornsiripanitch, Natee. 2020. “Why Are Residential Property Tax Rates Regressive?” Working Paper 22-02. Philadelphia, PA: Federal Reserve Bank of Philadelphia.
Avenancio-León, Carlos F. and Troup Howard. 2022. “The Assessment Gap: Racial Inequalities in Property Taxation.” The Quarterly Journal of Economics 137(3): 1383-1434.
Bartlett, Robert, Adair Morse, Richard Stanton, and Nancy Wallace. 2022. “Consumer-lending Discrimination in the FinTech Era.” Journal of Financial Economics 143(1): 30-56.
Bayer, Patrick, Marcus Casey, Fernando Ferreira, and Robert McMillan. 2017. “Racial and Ethnic Price Differentials in the Housing Market.” Journal of Urban Economics 102(November): 91-105.
Bayer, Patrick, Fernando Ferreira, and Stephen L. Ross. 2016. “The Vulnerability of Minority Homeowners in the Housing Boom and Bust.” American Economic Journal: Economic Policy 8(1): 1-27.
Berry, Christopher R. 2021. “Reassessing the Property Tax.” Working Paper. Chicago, IL: University of Chicago, Harris School of Public Policy.
Bhutta, Neil, Aurel Hizmo, and Daniel Ringo. 2022. “How Much Does Racial Bias Affect Mortgage Lending? Evidence from Human and Algorithmic Credit Decisions.” Finance and Economics Discussion Series 2022-067. Washington, DC: U.S. Board of Governors of the Federal Reserve System.
Bond, Shaun A. and Michael D. Eriksen. 2021. “The Role of Parents on the Home Ownership Experience of Their Children: Evidence from the Health and Retirement Study.” Real Estate Economics 49(2): 433-458.
Charles, Kerwin Kofi and Erik Hurst. 2002. “The Transition to Home Ownership and the Black-White Wealth Gap.” The Review of Economics and Statistics 84(2): 281-297.
Choi, Jung Hyun and Laurie Goodman. 2018. “Buy Young, Earn More: Buying a House Before Age 35 Gives Homeowners More Bang for Their Buck.” Washington, DC: Urban Institute.
Choi, Jung Hyun, Alanna McCargo, and Laurie Goodman. 2019. “Three Differences Between Black and White Homeownership That Add to the Housing Wealth Gap.” Washington, DC: Urban Institute.
Di, Zhu Xiao, Eric Belsky, and Xiaodong Liu. 2007. “Do Homeowners Achieve More Household Wealth in the Long Run?” Journal of Housing Economics 16(3-4): 274-290.
Faber, Jacob. 2021. “Contemporary Echoes of Segregationist Policy: Spatial Marking and the Persistence of Inequality.” Urban Studies 58(5): 1067-1086.
Ihlanfeldt, Keith and Tom Mayock. 2009. “Price Discrimination in the Housing Market.” Journal of Urban Economics 66(2): 125-140.
Kermani, Amir and Francis Wong. 2021. “Racial Disparities in Housing Returns.” Working Paper 29306. Cambridge, MA: National Bureau of Economic Research.
Lee, Hyojung, Dowell Myers, Gary Painter, Johanna Thunell, and Julie Zissimopoulos. 2020. “The Role of Parental Financial Assistance in the Transition to Homeownership by Young Adults.” Journal of Housing Economics 47(March): 101597.
Liu, Siyan and Laura D. Quinby. 2023. “What Factors Drive Racial Disparities in Housing Wealth Accumulation?” Working Paper 2023-3. Chestnut Hill, MA; Center for Retirement Research at Boston College.
Markley, Scott N., Taylor J. Hafley, Coleman A. Allums, Steven R. Holloway, and Hee Cheol Chung. 2020. “The Limits of Homeownership: Racial Capitalism, Black Wealth, and the Appreciation Gap in Atlanta.” International Journal of Urban and Regional Research 44(2): 310-328.
Mayock, Tom and Rachel Spritzer Malacrida. 2018. “Socioeconomic and Racial Disparities in the Financial Returns to Homeownership.” Regional Science and Urban Economics 70: 80-96.
Munnell, Alicia H., Geoffrey M. B. Tootell, Lynn E. Browne, and James McEneaney. 1996. “Mortgage Lending in Boston: Interpreting HMDA Data.” The American Economic Review 86(1): 25-53.
Myers, Caitlin Knowles. 2004. “Discrimination and Neighborhood Effects: Understanding Racial Differentials in US Housing Prices.” Journal of Urban Economics 56(2): 279-302.
Neal, Michael, Jung Hyun Choi, and John Walsh. 2020. “Before the Pandemic, Homeowners of Color Faced Structural Barriers to the Benefits of Homeownership.” Washington, DC: Urban Institute.
Newman, Sandra J. and C. Scott Holupka. 2015. “Is Timing Everything? Race, Homeownership and Net Worth in the Tumultuous 2000s.” Real Estate Economics 44(2): 307-354.
University of Michigan. Panel Survey of Income Dynamics, 1980-2019. Ann Arbor, MI: Institute for Social Research, Survey Research Center.
Zonta, Michela. 2019. “Racial Disparities in Home Appreciation.” Washington, DC: Center for American Progress.
Endnotes
- 1Munnell et al. (1996).
- 2Liu and Quinby (2023).
- 3For example, see Aaronson, Hartley, and Mazumder (2021) and Faber (2021).
- 4Bond and Eriksen (2021).
- 5Choi and Goodman (2018); Lee et al. (2020); and Charles and Hurst (2002).
- 6Bhutta, Hizmo, and Ringo (2022). Similarly, recent studies no longer find evidence of discrimination in mortgage pricing (see, for example, Bartlett et al. 2022).
- 7Choi, McCargo, and Goodman (2019) and Neal, Choi, and Walsh (2020).
- 8Di, Belsky, and Liu (2007); Newman and Holupka (2016); Mayock and Malacrida (2018); and Markley et al. (2020). Lower appreciation could also push Black households to invest less in their homes since other asset classes perform relatively better.
- 9Additionally, Black buyers typically pay a premium to purchase their home due to pervasive price discrimination (Bayer et al. 2017; Ihlanfeldt and Mayock 2009; Myers 2004; and Zonta 2019). And similar discrimination in home appraisals raises the amount of property taxes levied on Black homes (Amornsiripanitch 2020; Avenancio-Leon and Howard 2022; and Berry 2021).
- 10Bayer, Ferreira, and Ross (2016).
- 11Kermani and Wong (2021).
- 12Specifically, we follow households until the financial respondent (typically the primary earner) is age 55. Since some households transition between renter and homeowner multiple times, the sample is further limited to households that remain homeowners consistently from the time of first purchase to age 55. And the focus is on the primary residence rather than wealth built through vacation or investment properties since a majority of households own only one home.
- 13Specifically, the purchase price of Black-owned homes in our analysis was 15 percent less. In theory, smaller down payments could have resulted from Black households taking on more debt to acquire homes of similar value to White households. However, the simulated loan-to-value ratio is almost identical.
- 14See Liu and Quinby (2023) for details.
- 15For instance, if we run the inverse thought experiment – asking how large the age-55 gap would have been had Black households started off with their actual initial housing wealth, but had subsequently earned the faster White appreciation rate – we find that initial disparities account for 64 percent of the age-55 gap, and appreciation the other 36 percent.


Liu, Siyan and Laura D. Quinby. 2023. "What Drives the Racial Housing Wealth Gap for Older Homeowners?" Issue in Brief 23-7. Chestnut Hill, MA: Center for Retirement Research at Boston College.